As the station captures images, these images are loaded into the dataset attached to the corresponding station group. The station dashboard presents these captured images and metadata for detailed analysis.
Under Vision Command, click the Dashboard icon on the left navigation pane.
Locate the Station for which the summarized data is available, and click the Station name to drill down.
The Station Dashboard page will display a graphical view of the total “defect_rate” and “throughput_rate” for the current day or the selected period.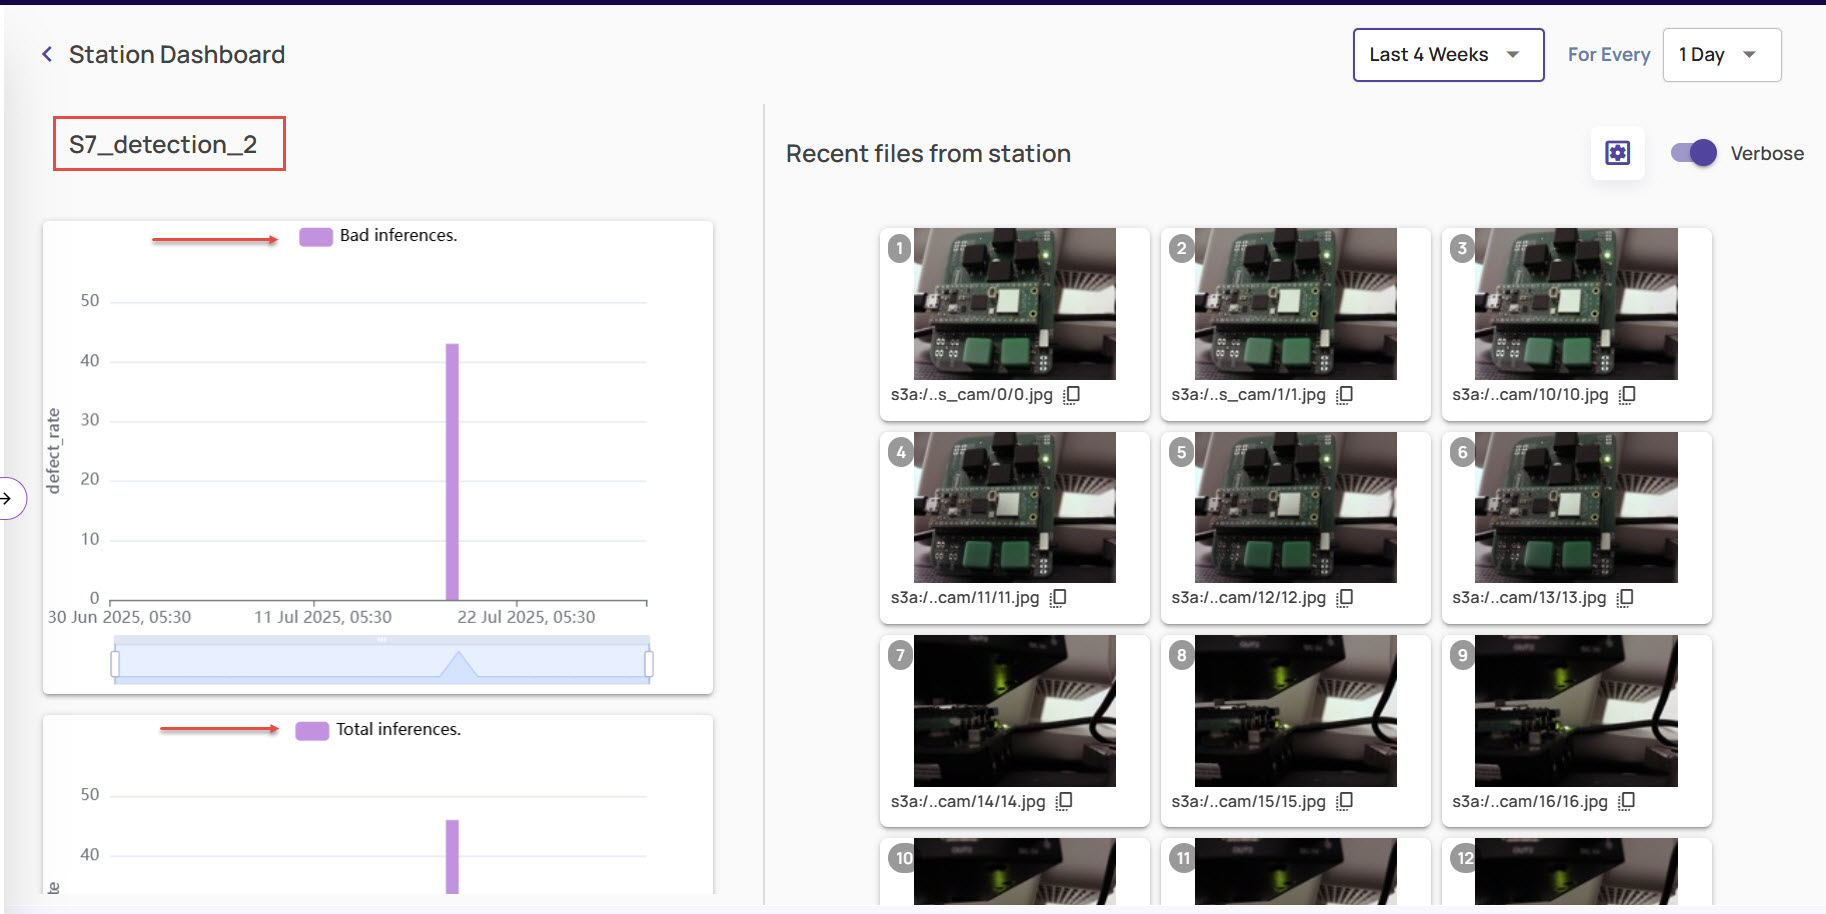
Click a point on the Bad inferences bar, to view the images analyzed and defects identified, with details of the time range, and the number of bad inferences.
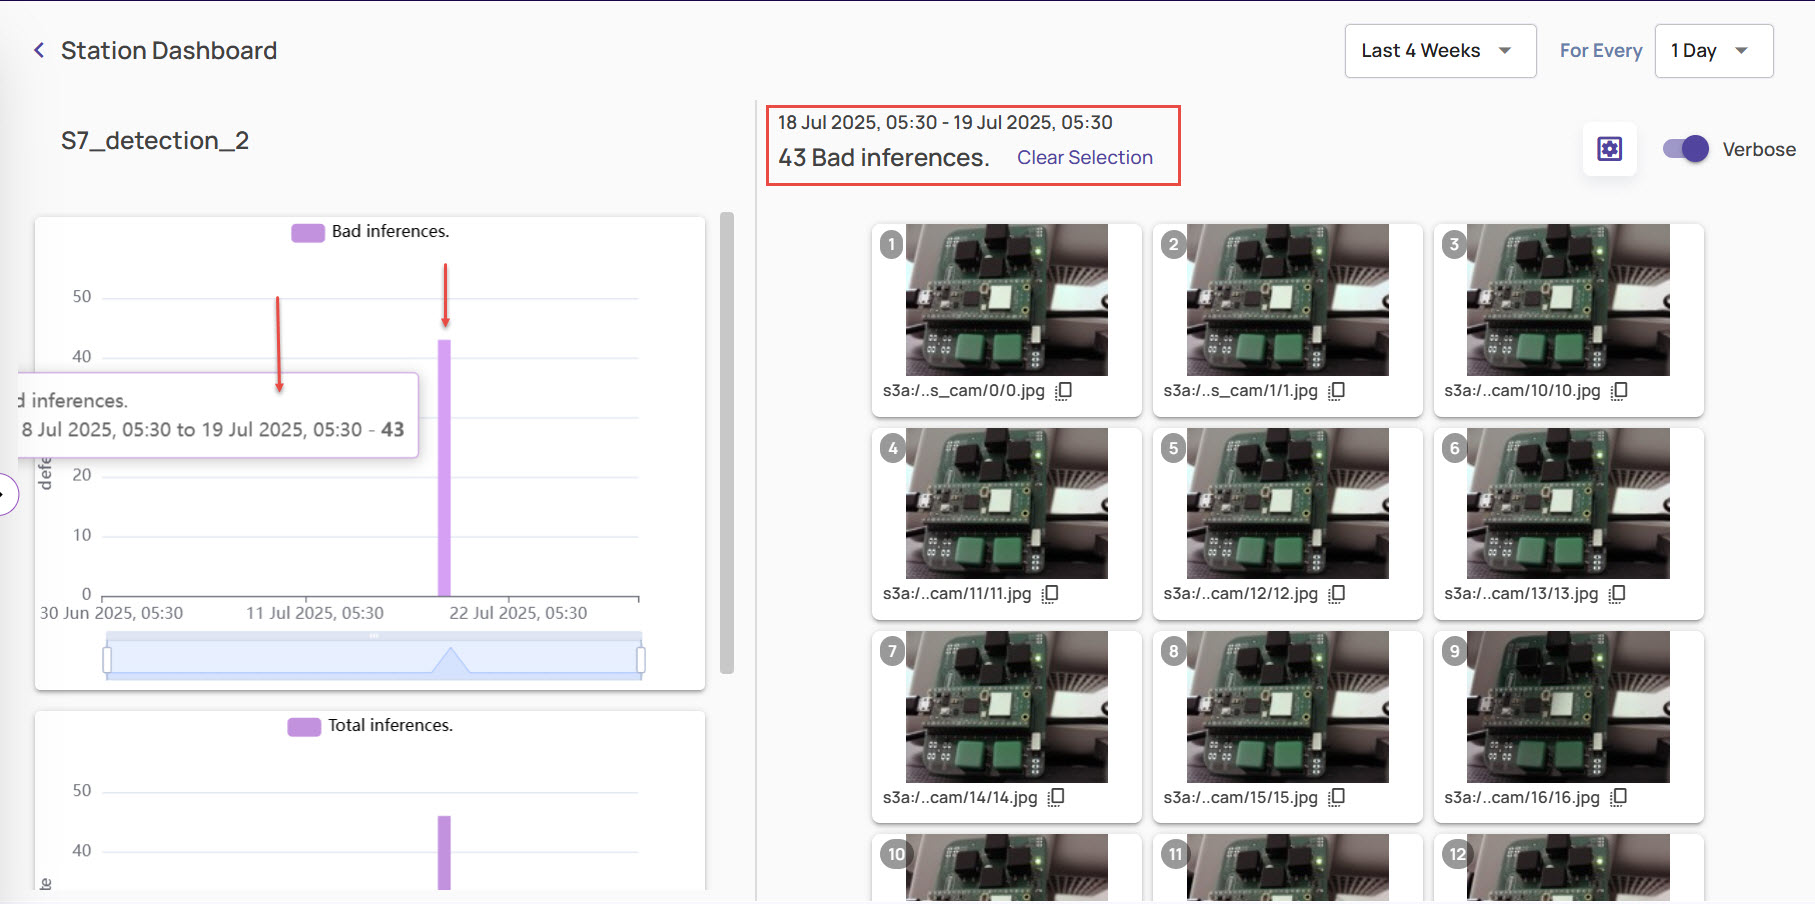
It also displays the recent files available from the station for analysis.You can click any of the images to view it in high-resolution mode, and zoom in and out, toggle between landscape and portrait modes, and enable and view catalog tags, as needed.
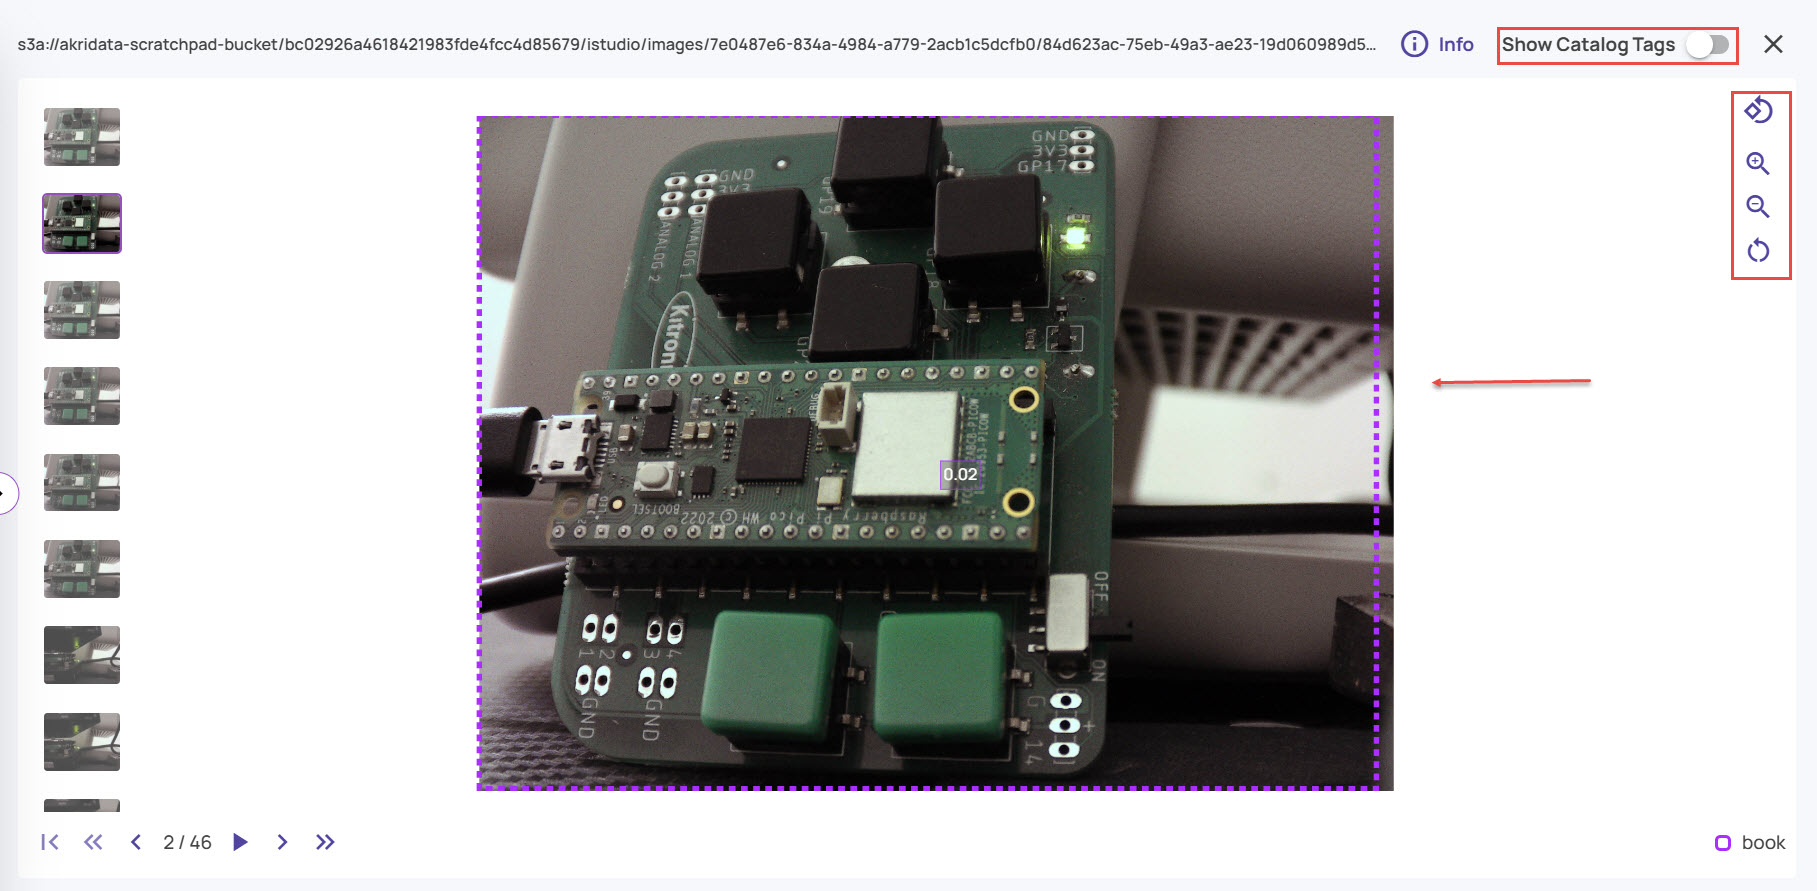
In case any image frame was configured for heatmap during ingestion, selecting the image in full resolution mode will display the heatmap view of the image, as shown below:
.jpg)
View the defect or throughput rates for different durations, as needed.
Click the arrowhead on the time range drop-down on the top-right corner.
Select any required time range to view the station data graph.
For example, the following image displays the throughput rate of images aggregated every 1 day over 4 weeks.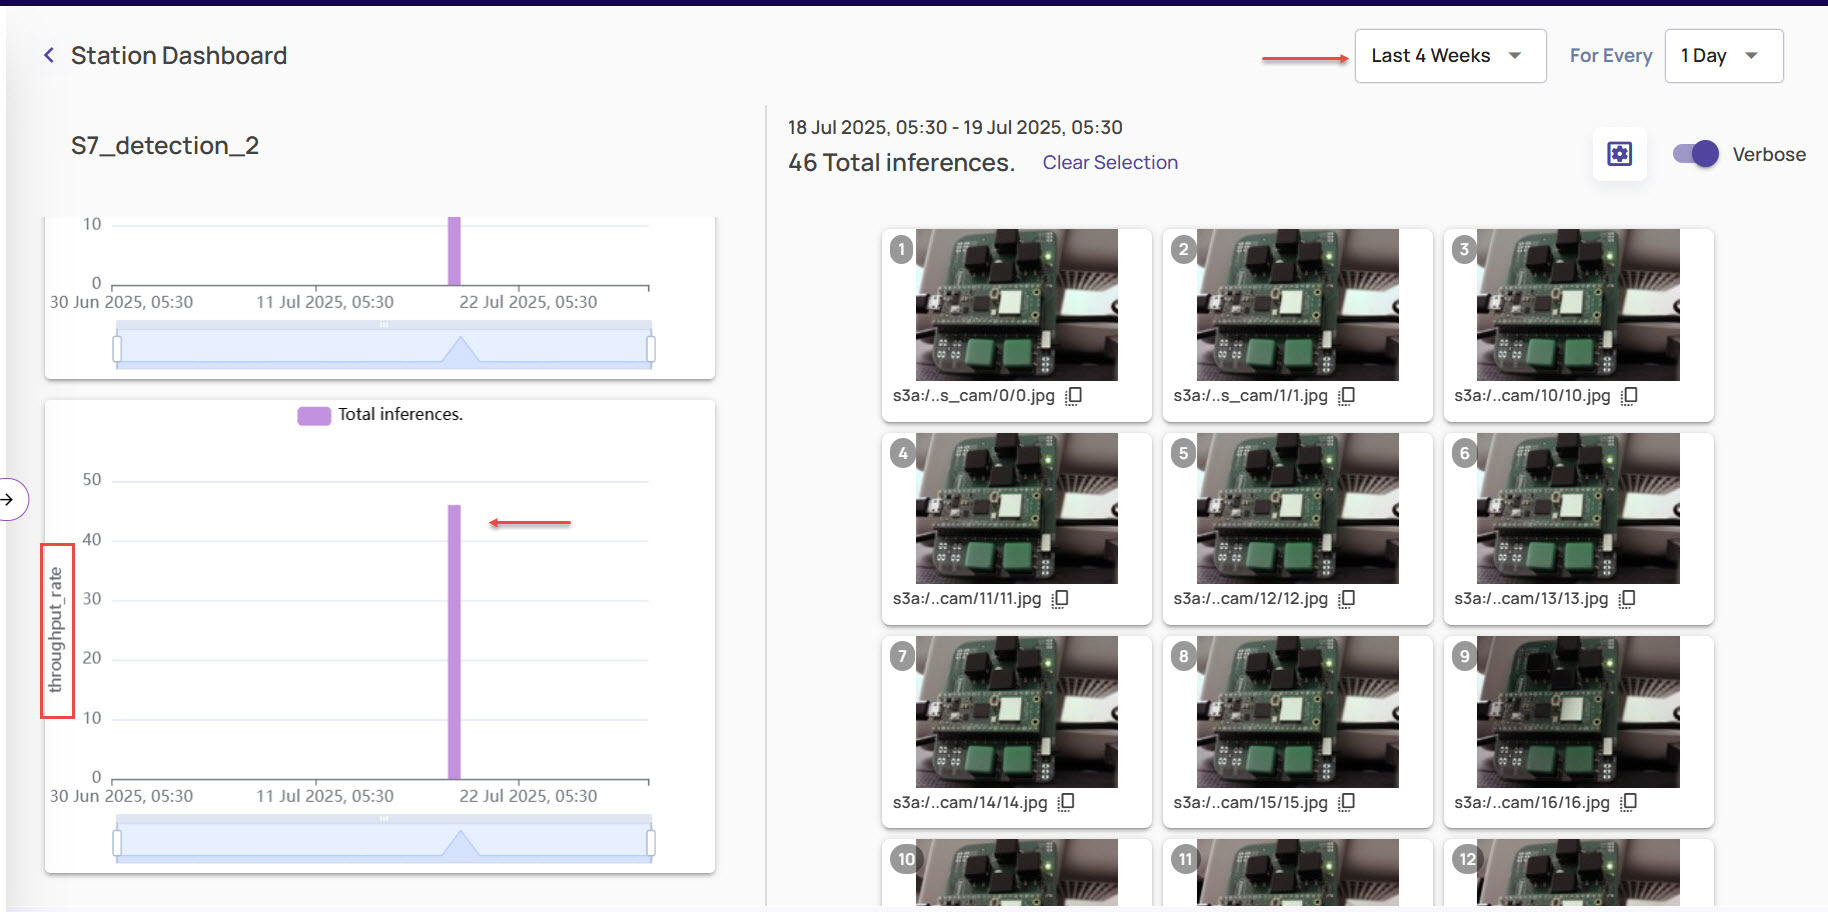
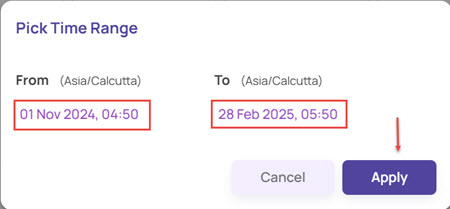
You can also set a custom time range to view the defect or throughput details.
Click Custom from the Time Range drop down.
In the Pick Time Range window, select the From and To date and time.
Click Apply to set the time range parameter.
Once the graph is displayed based on the selected time range, click the respective graph sections to check the images.
As you will notice, under defect_rate, the classes that were not in the ‘good’ class list configured against the station group are highlighted with red borders.
You can do further analysis of the “defect_rate” and “throughput_rate” from the Analytics page.