The Analytics page of Vision Command allows for a more detailed analysis of the captured data based on various query and aggregation parameters. The analysis will enable you to compare data points between two or more stations and view the throughput or defect rate accumulated over a period of time.
View Analytics Data
Navigate to Vision Command > Analytics.
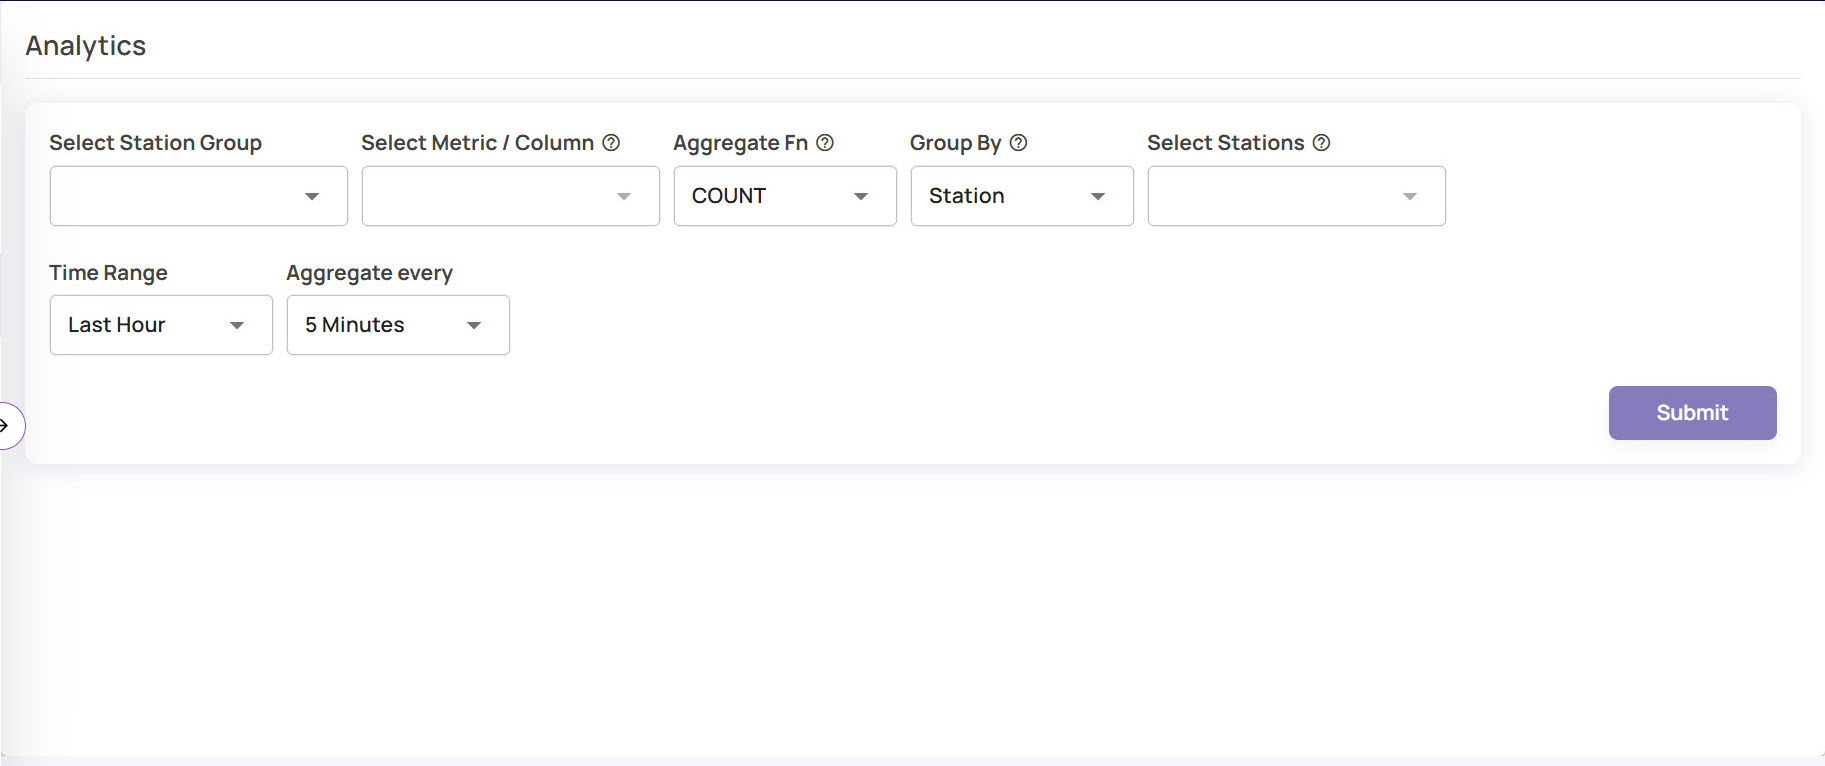
On the Analytics page, specify the query parameters, as needed. The page will display the aggregated data collected in each timespan according to the specified duration.
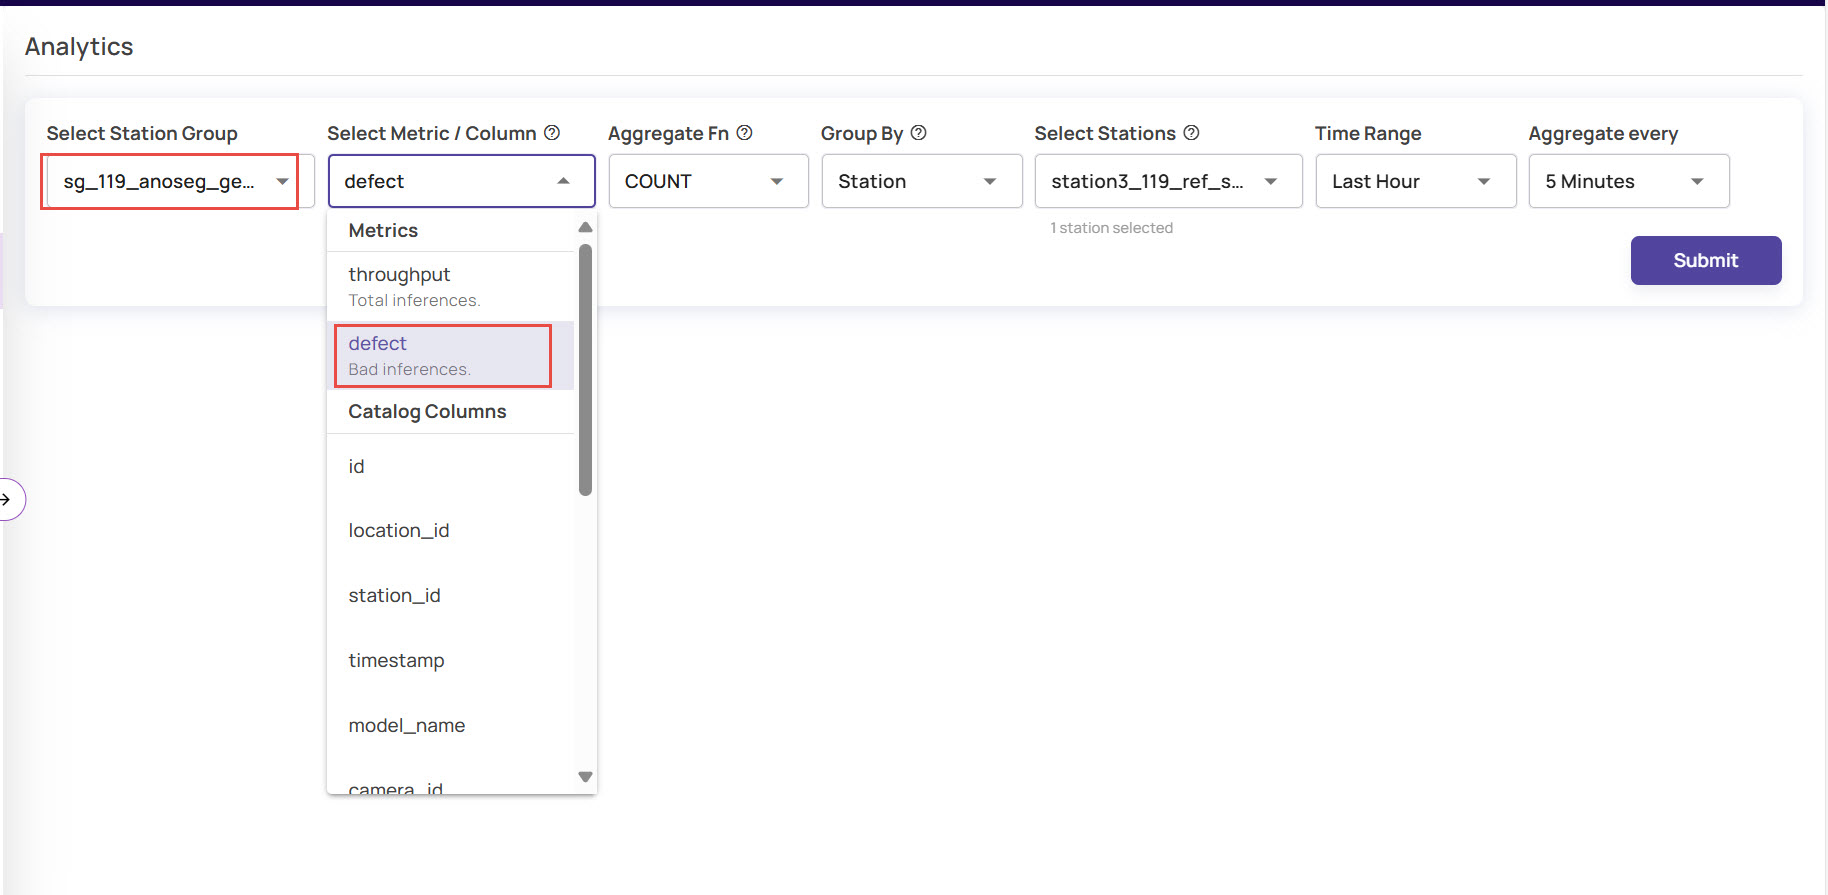
Select Station Group: Select the Station Group for which you want to view the defect or throughput rate of the images.
Select Metric/Column: Select defects, throughput rate, or any Catalog Column based on which you want to aggregate the data per the specified aggregate time in a given time range.
For example:Select defect or throughput to view the number of bad or total inferences.
Select from the Catalog Columns, such as station_id, file_path, timestamp, and so on, to view the aggregated image details according to the time range and other parameters.
Aggregate Fn: This field selects the aggregation function to be applied on the catalog rows to generate a time aggregated results over specified duration windows.
For example, you can select COUNT to get the number of defects in every 10-minute window over the last hour.Group By: You can view the analysis for each Station or Line, as needed. There will be a line graph for each selected group. For example, if the 'group by station' option is selected, then one line graph will be displayed per station.
Select Station or Select Line, to filter metrics to specific set of lines or stations.
Time Range: Select the time range for which you want to query the results. You can select from the drop-down list or set a custom time range, as needed.
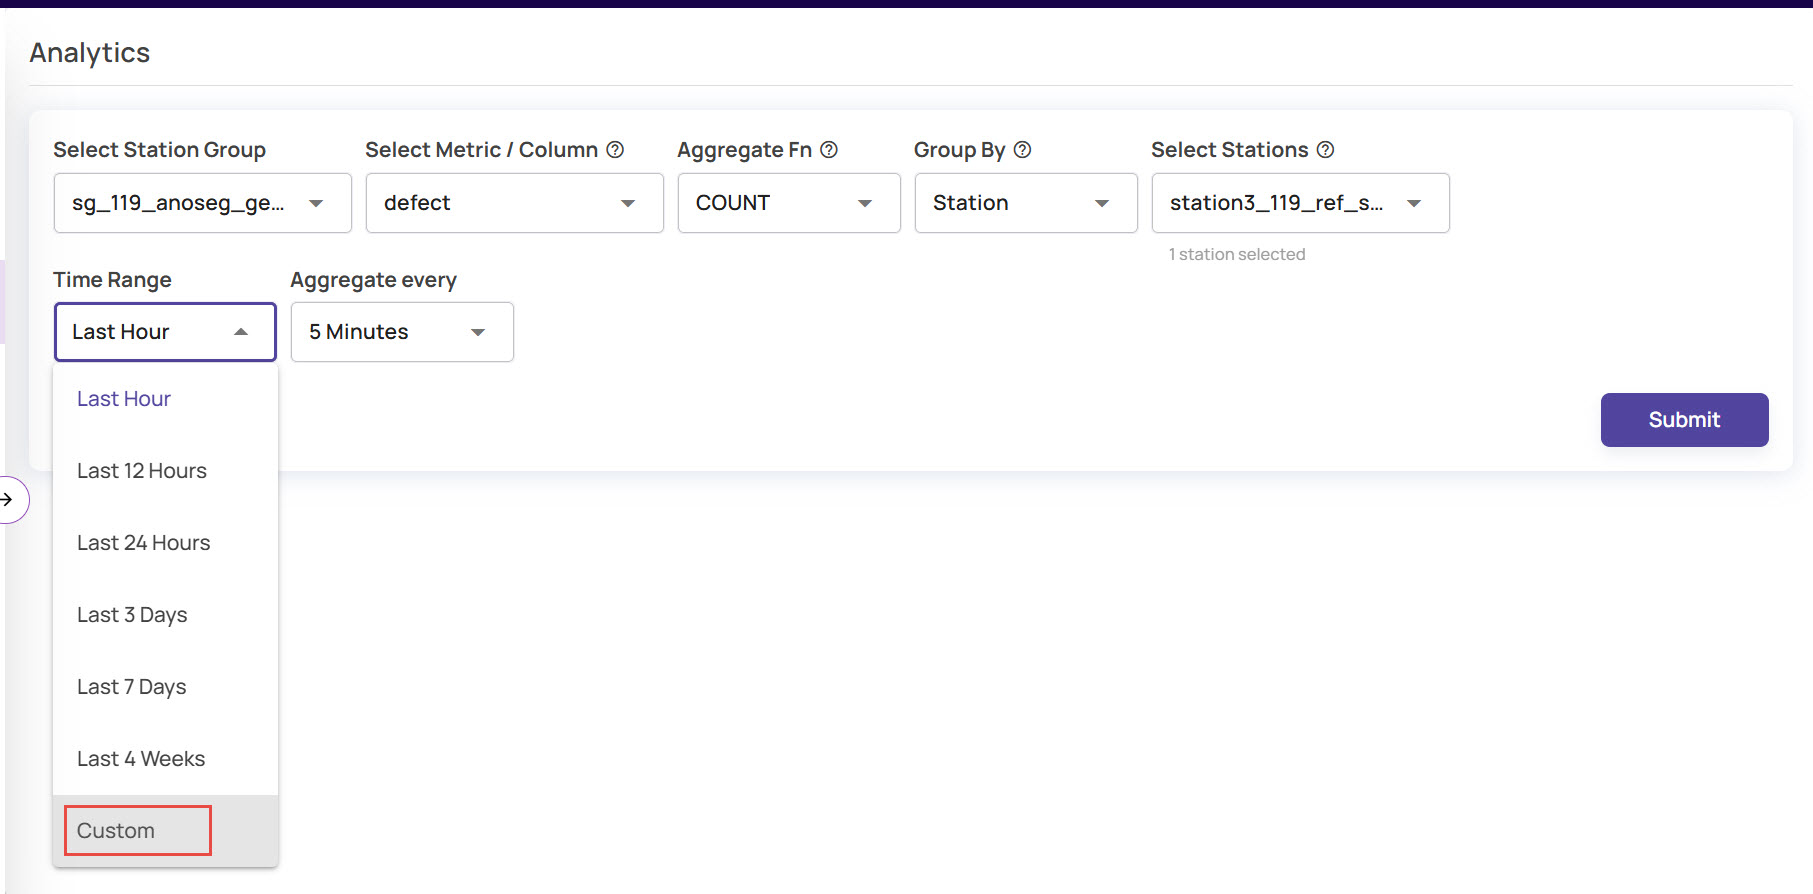
Click Custom from the Time Range drop down.
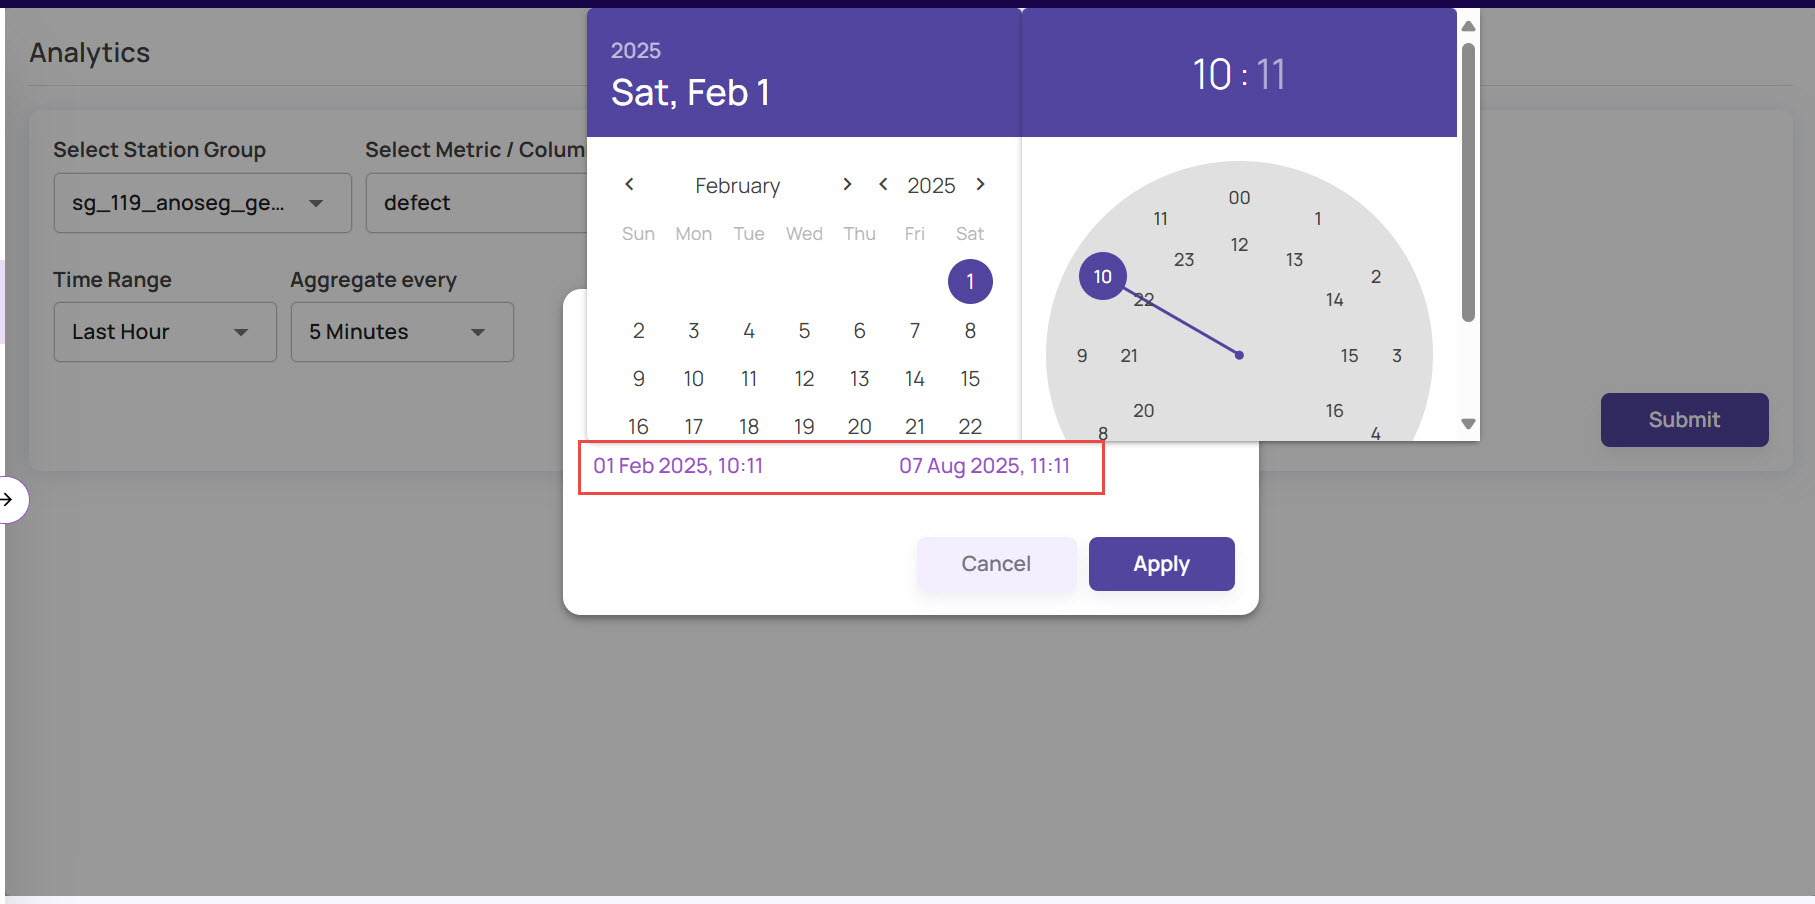
In the Pick Time Range window, select the From and To date and time.
Click Apply to set the time range parameter.
Aggregate every: Select the time duration over which aggregation must be applied.
Click Add Filter to provide additional conditions to apply the query parameters on images. This is applicable only if you selected a catalog column in ‘Select Metric/Column’ before.
In the Add Filter window, click the Add Conditions and Add Custom Condition buttons as needed, and click Apply.
For example, if you had selected timestamp as the column, you can add the filter conditions where the timestamp equals to the specified value, as shown below: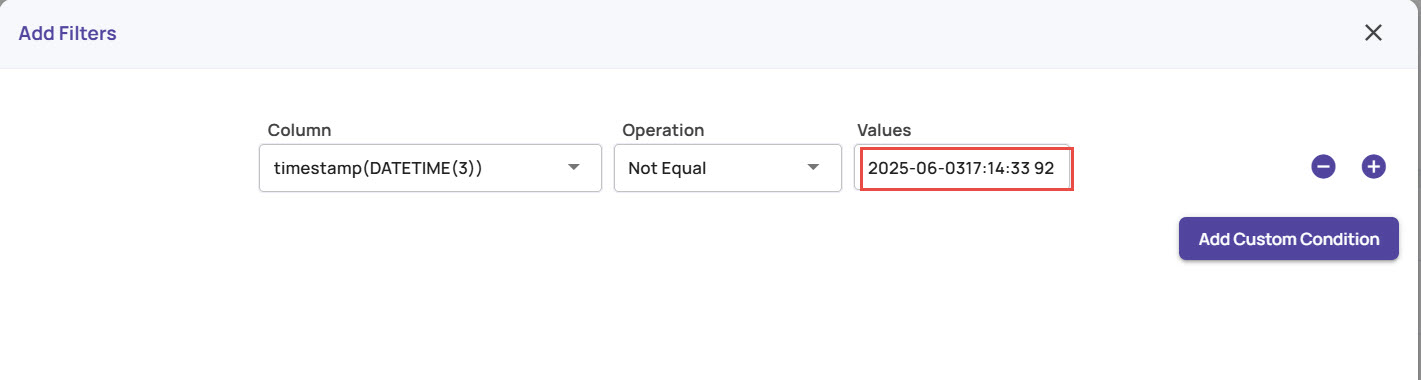
Timestamp
The timestamp supports values in microseconds to ensure accurate display of the analytics. However, entering microseconds is optional; in such cases, the microsecond value is defaulted to ‘00’.
Similarly, you can view the analytics for any other column selected as the metrics, as shown:

In the Analytics page, click Submit.
Once the query fetches the required information, it is displayed in a line graph format.
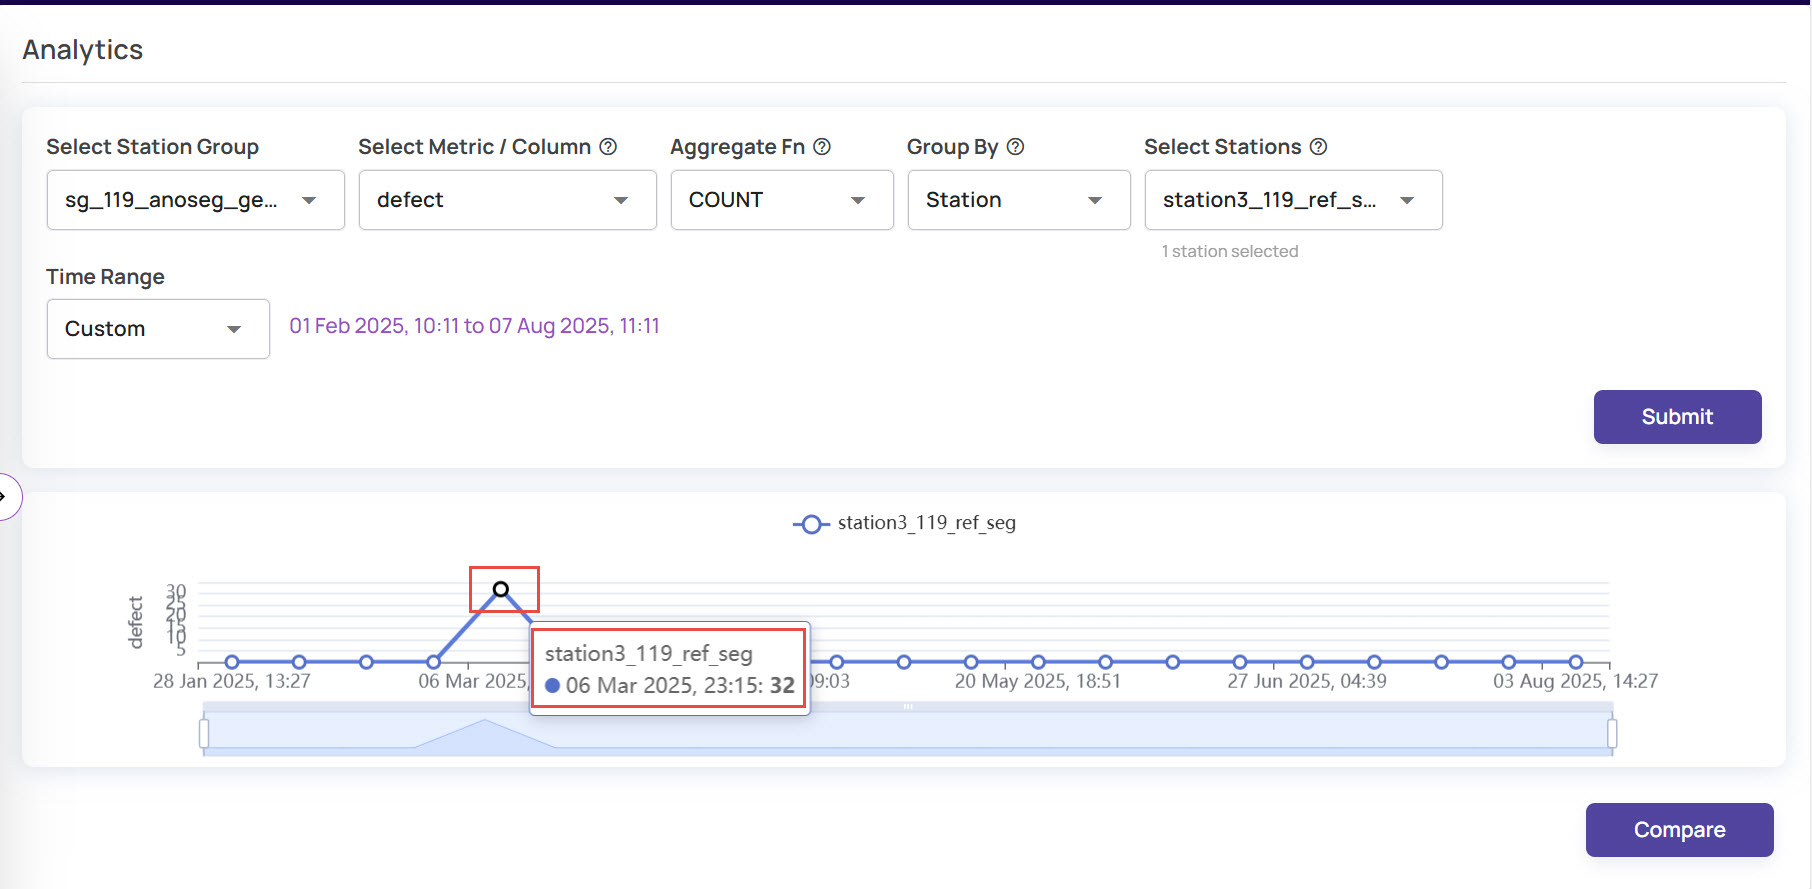
If there are more than one station in that station group, the group will display multiple lines in the graph for comparative analysis. The analytics allows you to compare the throughput or defects at a given point between two or more stations.Click the point on the line graph to analyze the data at that given time and view the respective images.
If you had selected the metrics as Defects, all images with defects would be highlighted with red borders.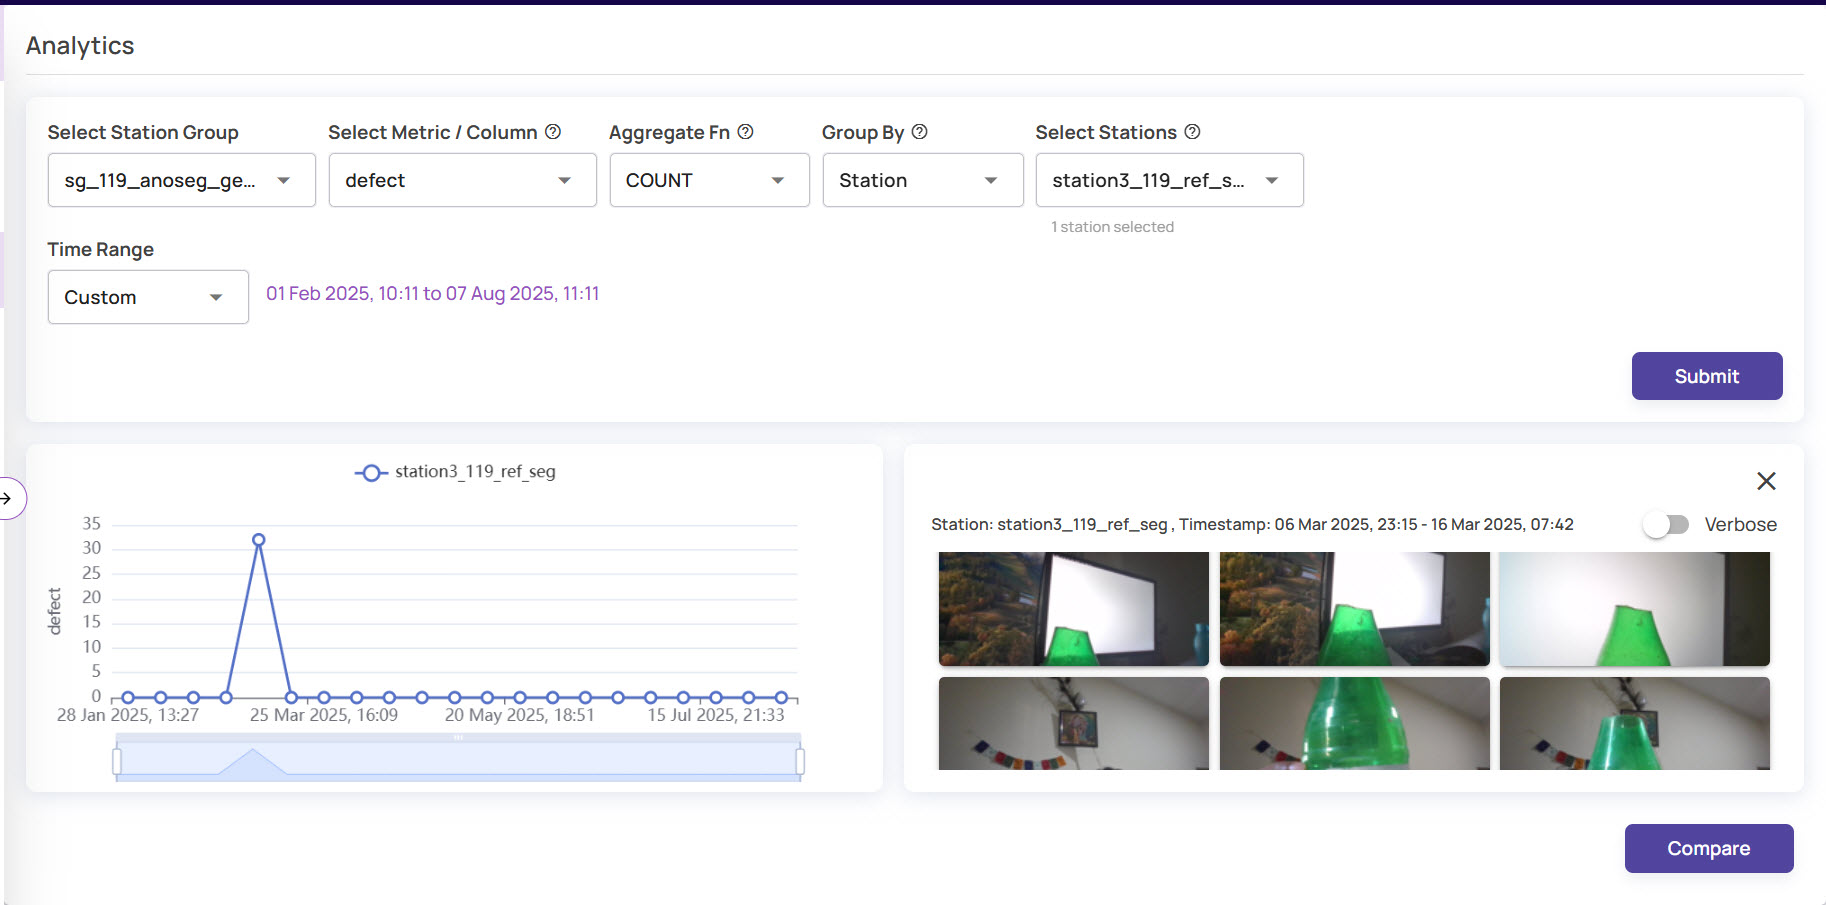
As you will notice, the details of the station ID and timestamp are displayed right above the images.Enable the 'Verbose' option on the images panel to view the details of the images, including the index for each image.
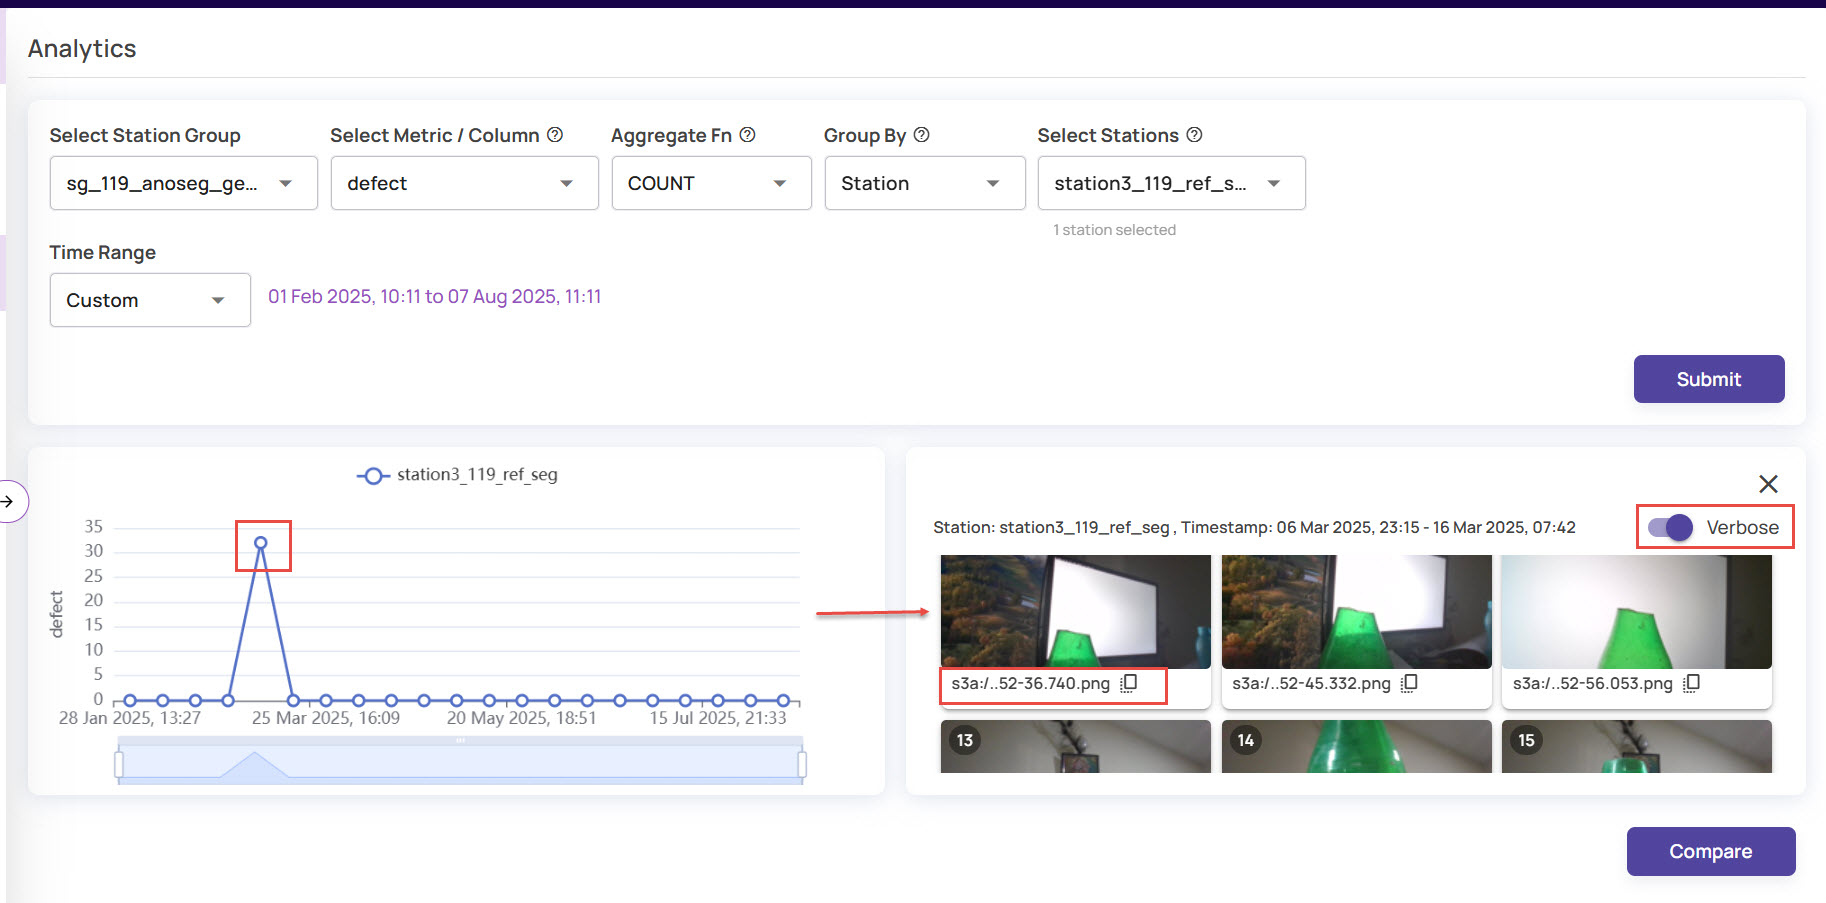
Click any of the images to view in full resolution mode.
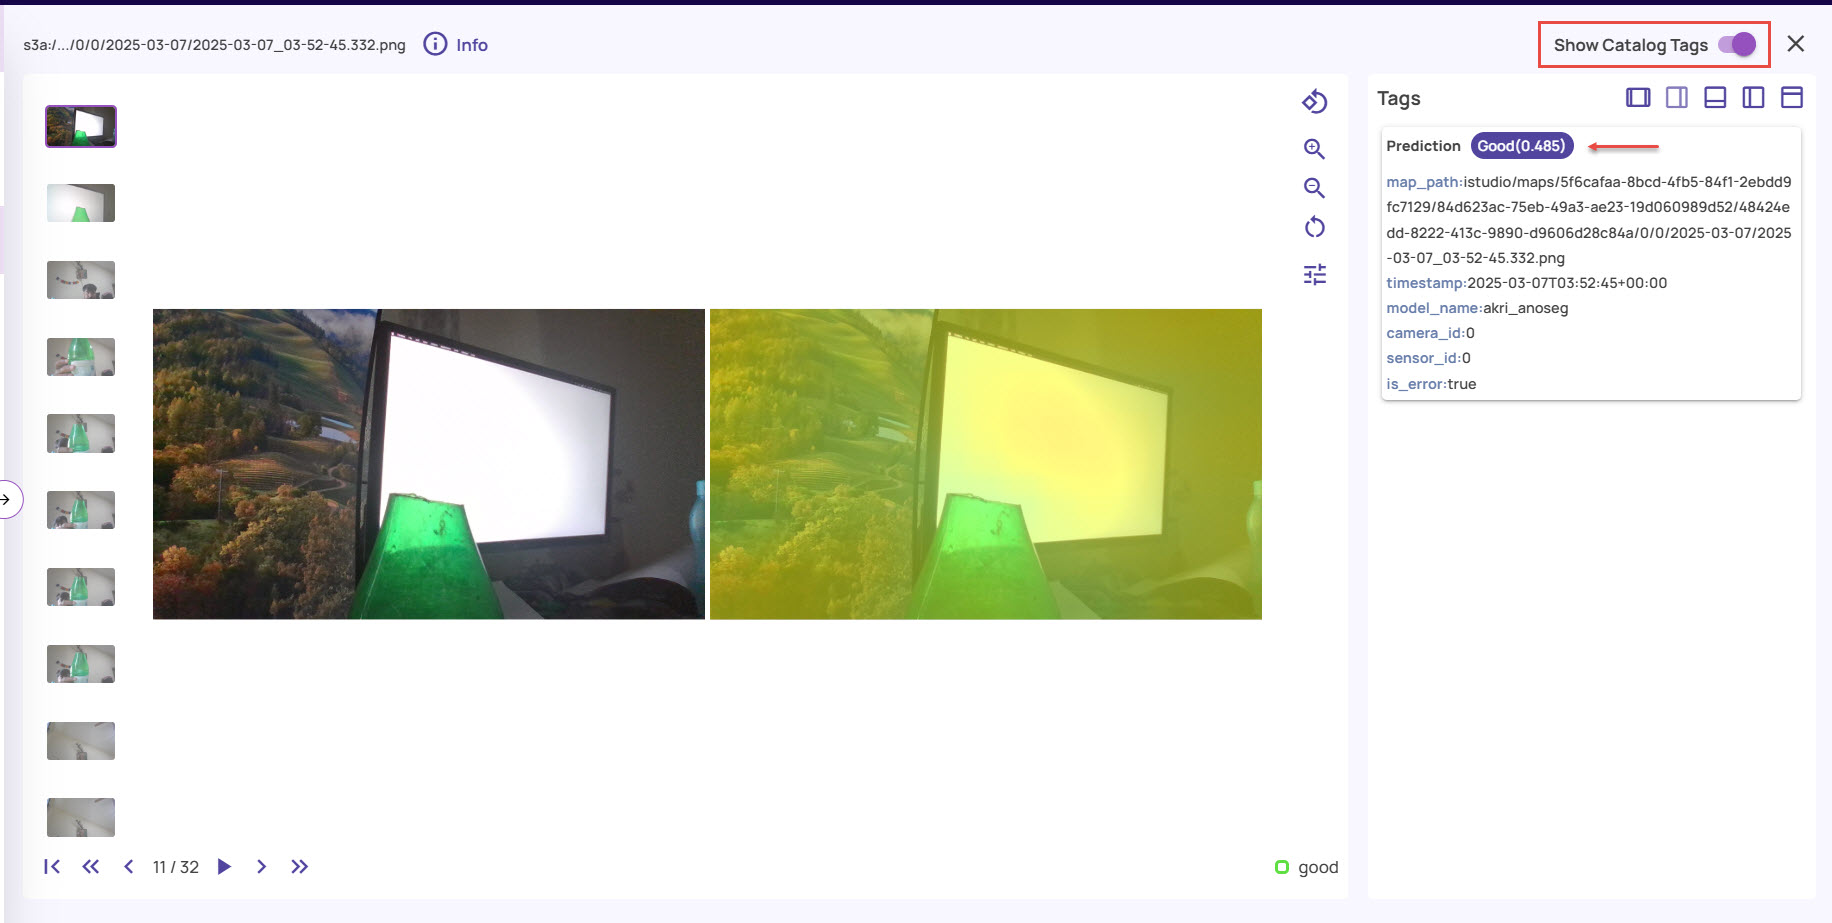
Enable the Show Catalog Tags option to view the prediction and other related details.
Compare Analytics Data
Compare is a general capability that allows you to compare captured images across two stations, the same station at two timestamps (such as today and yesterday), and so on. This capability provides insights to analyze trends and identify root cause issues by comparing against a time range where there were no issues. For example, suppose a station B encountered an issue where the lighting conditions changed significantly, resulting in a spike in the defect rate. To determine the root cause of the defect rate spike, comparing images between Station A and Station B at a given time stamp or comparing Station B images before and after the spike will reveal the lighting condition change as the root cause.
To compare, create an analytics query as described before.
On the Analytics screen, click the Compare button at the bottom-right corner.
.jpg)
On the screen, select any two points one after the other, and click Compare.
.jpg)
The comparison between the two data points displays the set of images for which defects were found at two different times. This helps in analyzing whether the defects found are the same or different at two different times.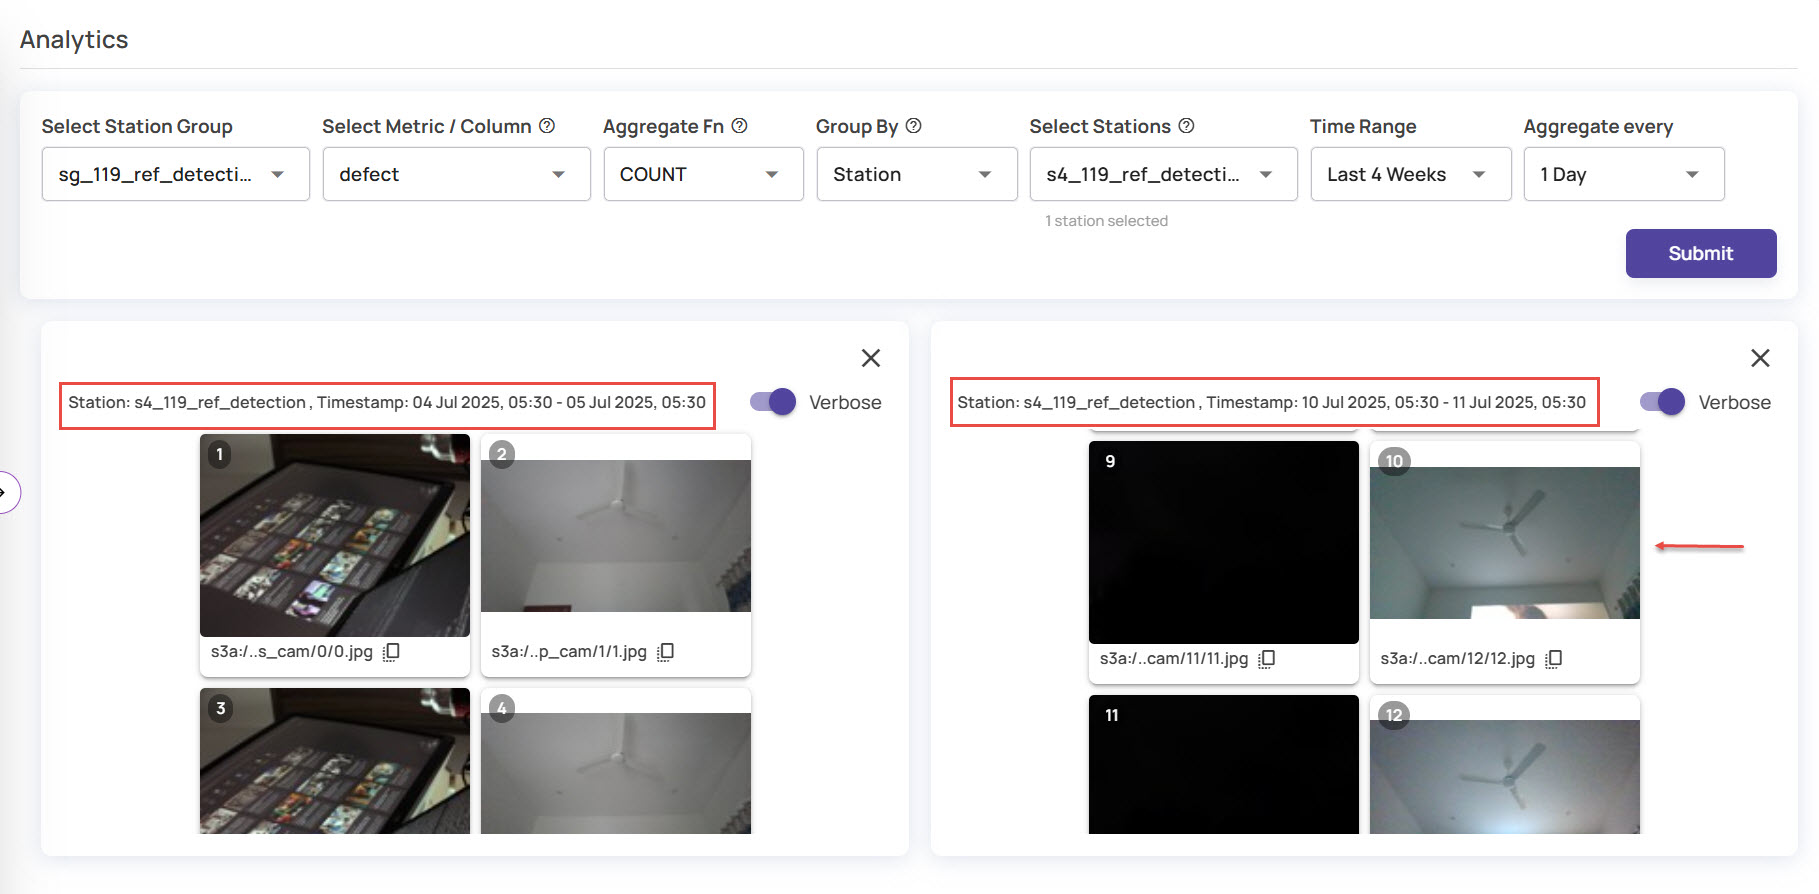
If defects are identified when viewing analytics for two or more stations, you can compare the defects between the two points for each station and determine if the defects are consistent or if there is any change.