Once an anomaly model result based on the good images and test images is available, you can view it under the Results tab of the project catalog.
The Results tab displays the anomalies indicated with red dots on the top right of the test images submitted for inference.
View anomaly segmentation model results
Refer to the following video to browse and view anomaly segmentation model results.
View Anomaly models
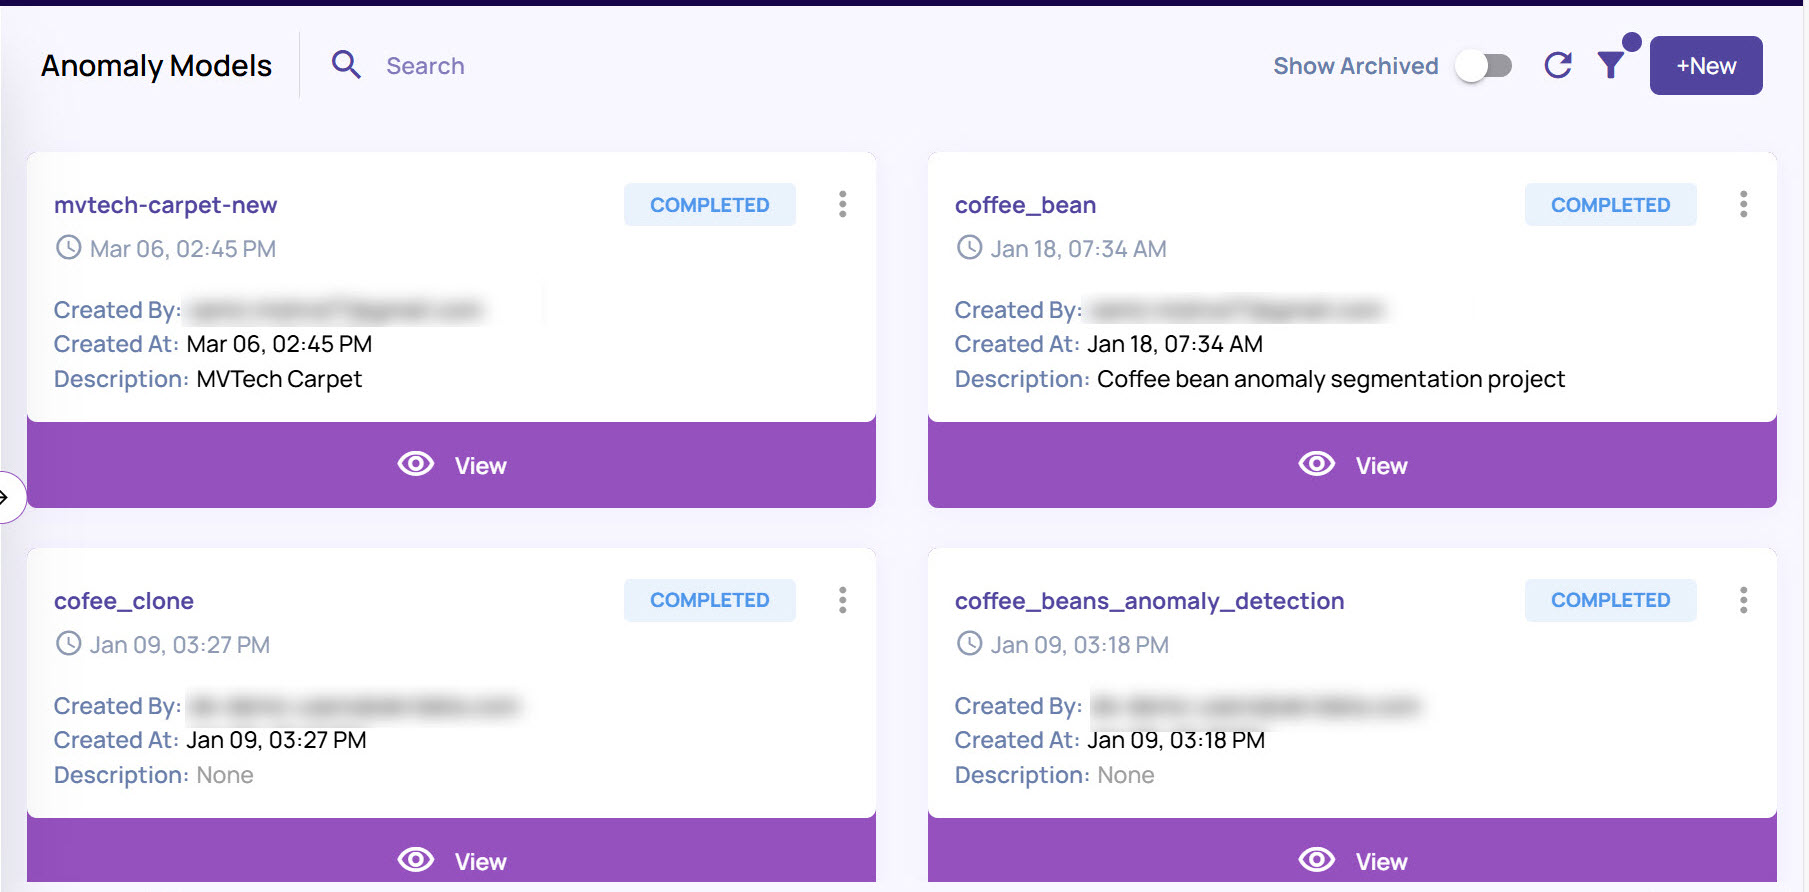
Once you have created an anomaly model, you can view the anomaly model in the Anomaly Models page.
To filter and search for anomaly models
Click the Filter icon on the top right corner.
Select from Draft, Training, Failed, or Completed, and click Apply.
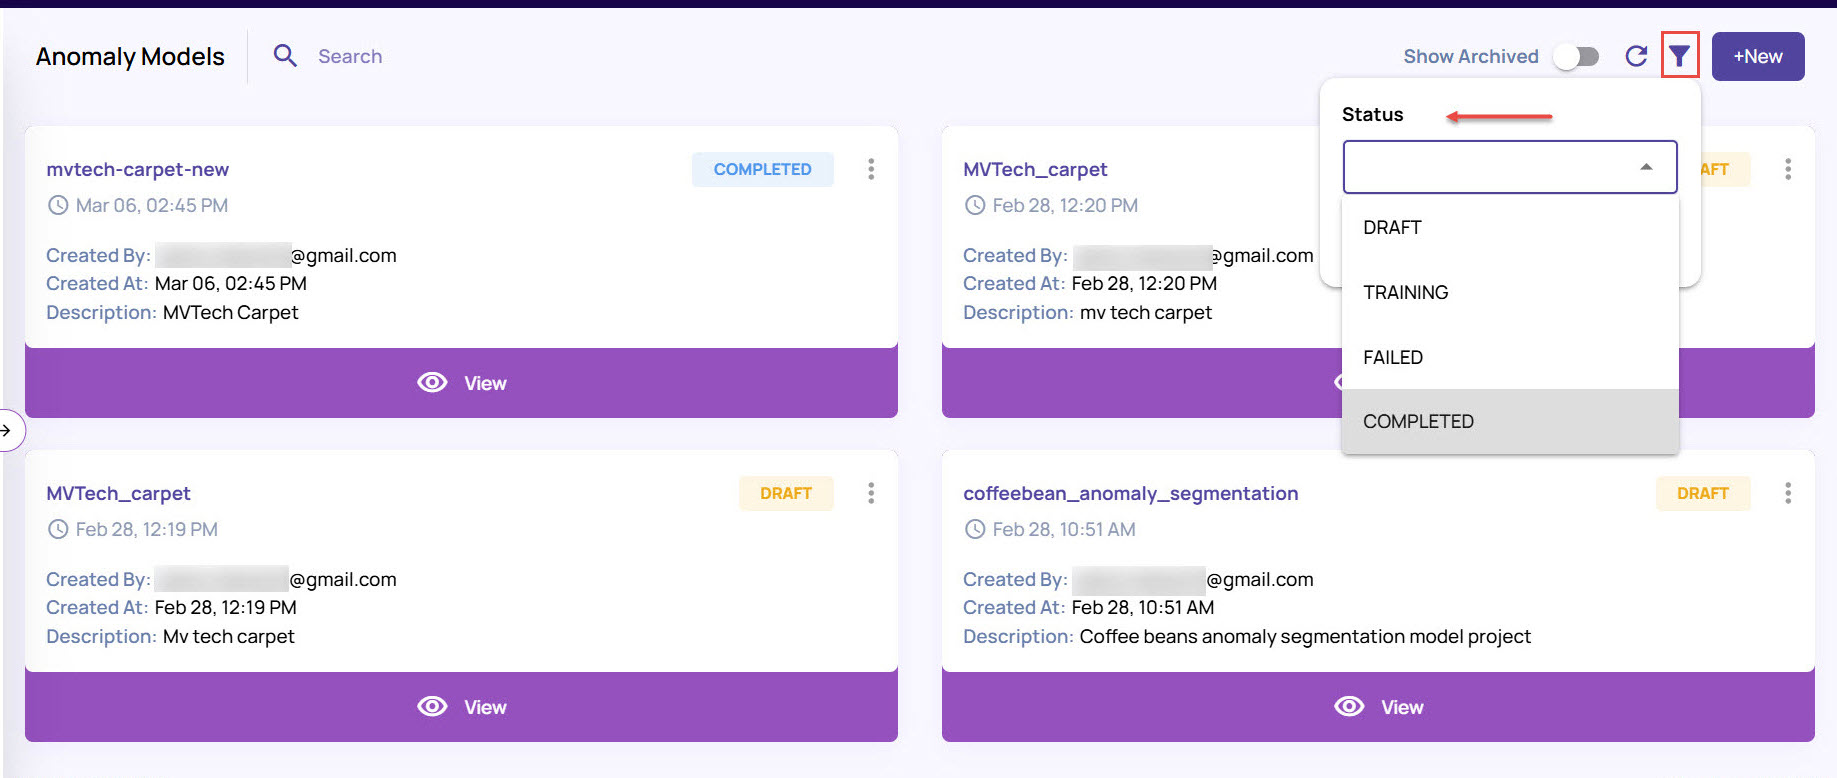
Based on the selection, the Anomaly Models page displays the list of models.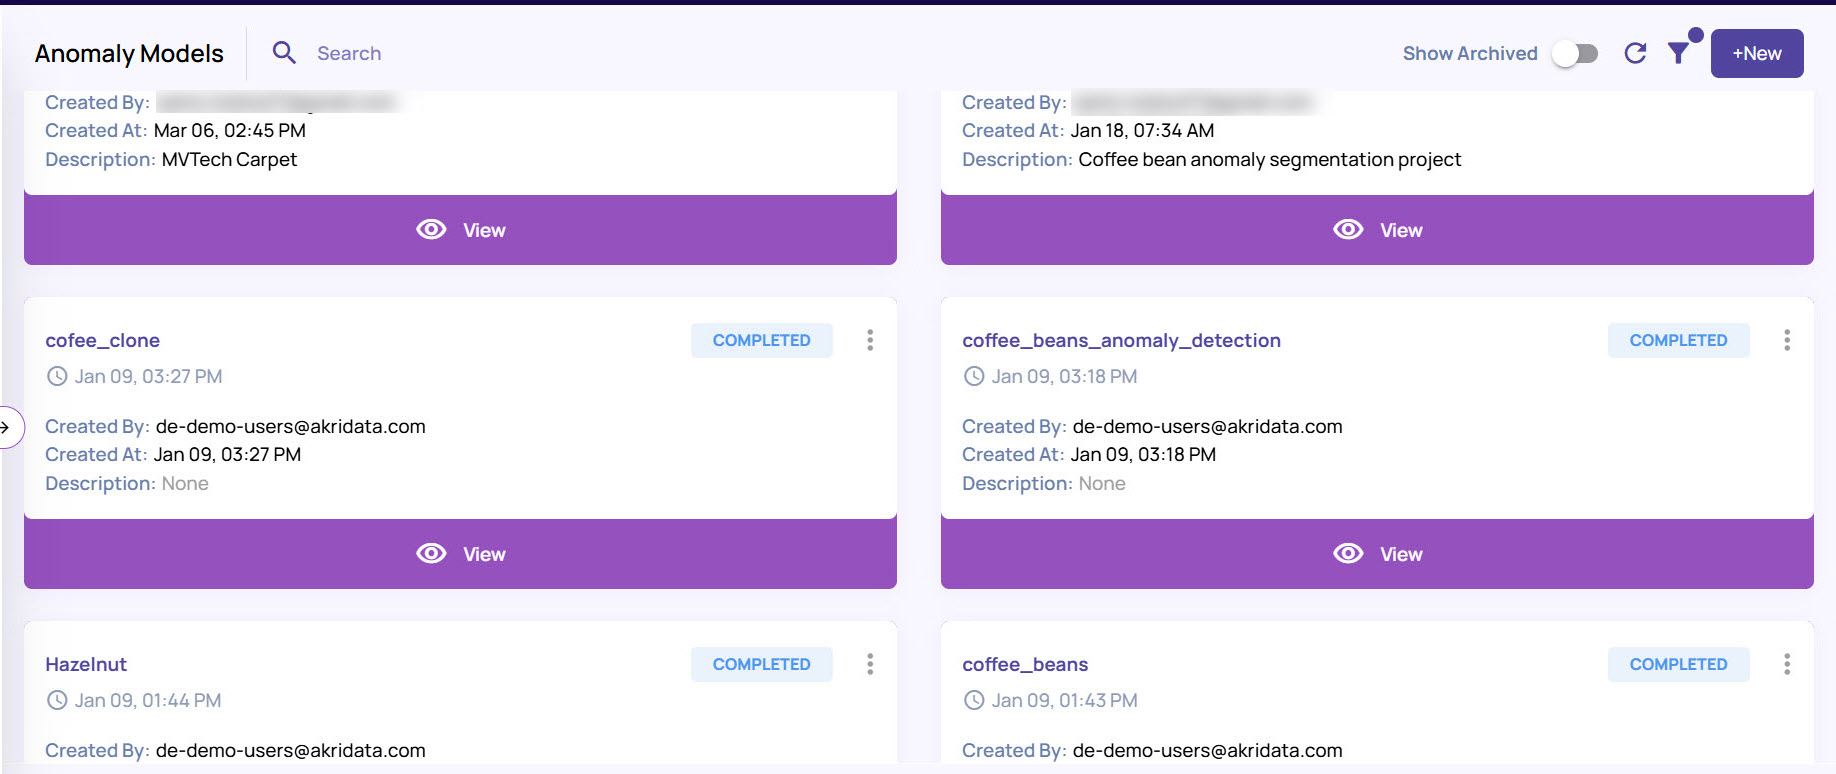
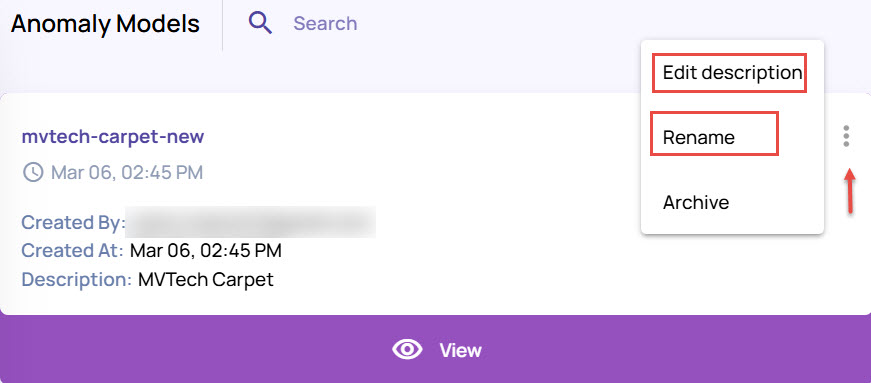
To edit the anomaly model details
Click the 3-dots icon on an anomaly model card.
Click Edit description to edit the description for the model.
Click Rename to rename the model.
Archive and unarchive an anomaly model.
To archive an anomaly model, click the 3-dots icon on an anomaly model card and select Archive.
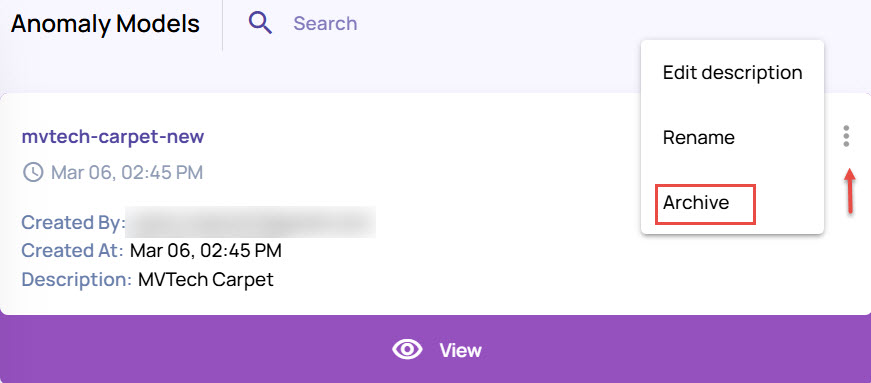
The model gets archived and is not displayed in the Anomaly Models page.To view the archived models on the page, enable the Show Archived option on the top-right corner of the page.
.jpg)
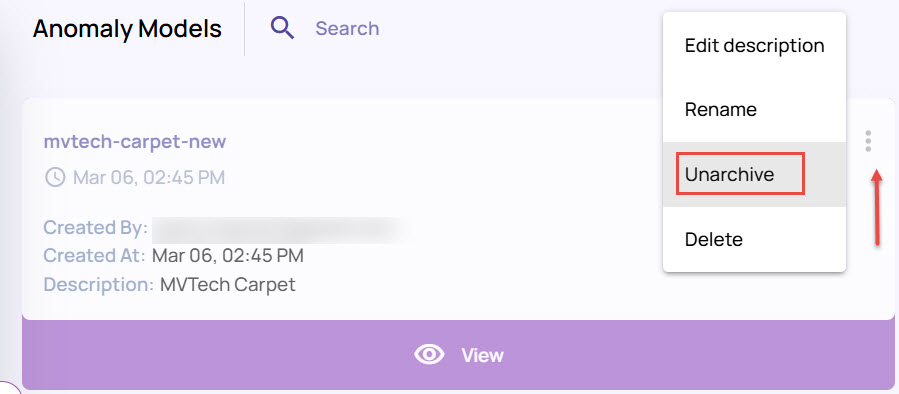
The archived models appear on the page.To unarchive the model, click the 3-dots icon on the archived model card, and click Unarchive.
On the 3-dots icon, click Delete to delete the anomaly model.
Access model results
In the left navigation panel, navigate to Model Copilot > Anomaly Segmentation.
In the Anomaly Models screen, locate the card corresponding to the model. If the status is Completed, then click the View button to land on the Results page.
.jpg)
Set up anomaly display settings
On clicking the View option on the anomaly card, the anomaly page displays the details of the anomalies found. The page includes various functions to help you analyze the anomaly in more detail.
In the model screen, click the Settings icon on the top-right corner.
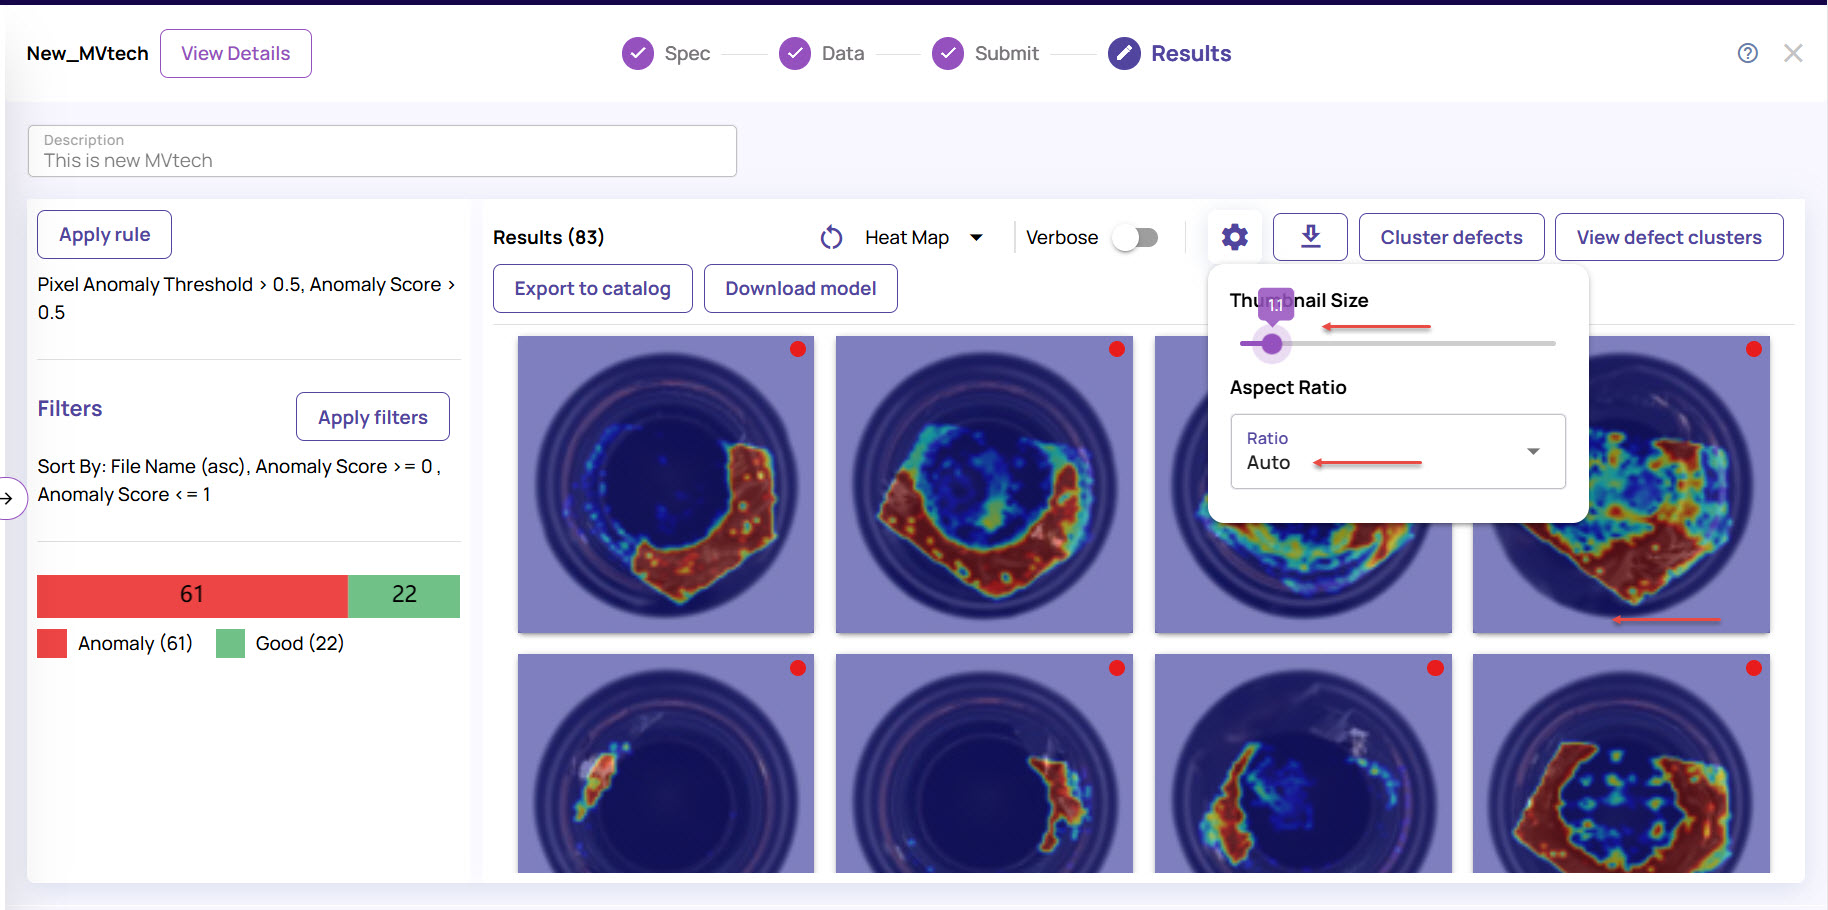
Set the Thumbnail Size of the images by dragging the size bar.
Set the Aspect Ratio for the image frames. The default ratio is set to Auto.
Click the Heat Map drop-down to set the Show heat map and Opacity options.
The heatmap image highlights the anomalies with bright colors, as shown.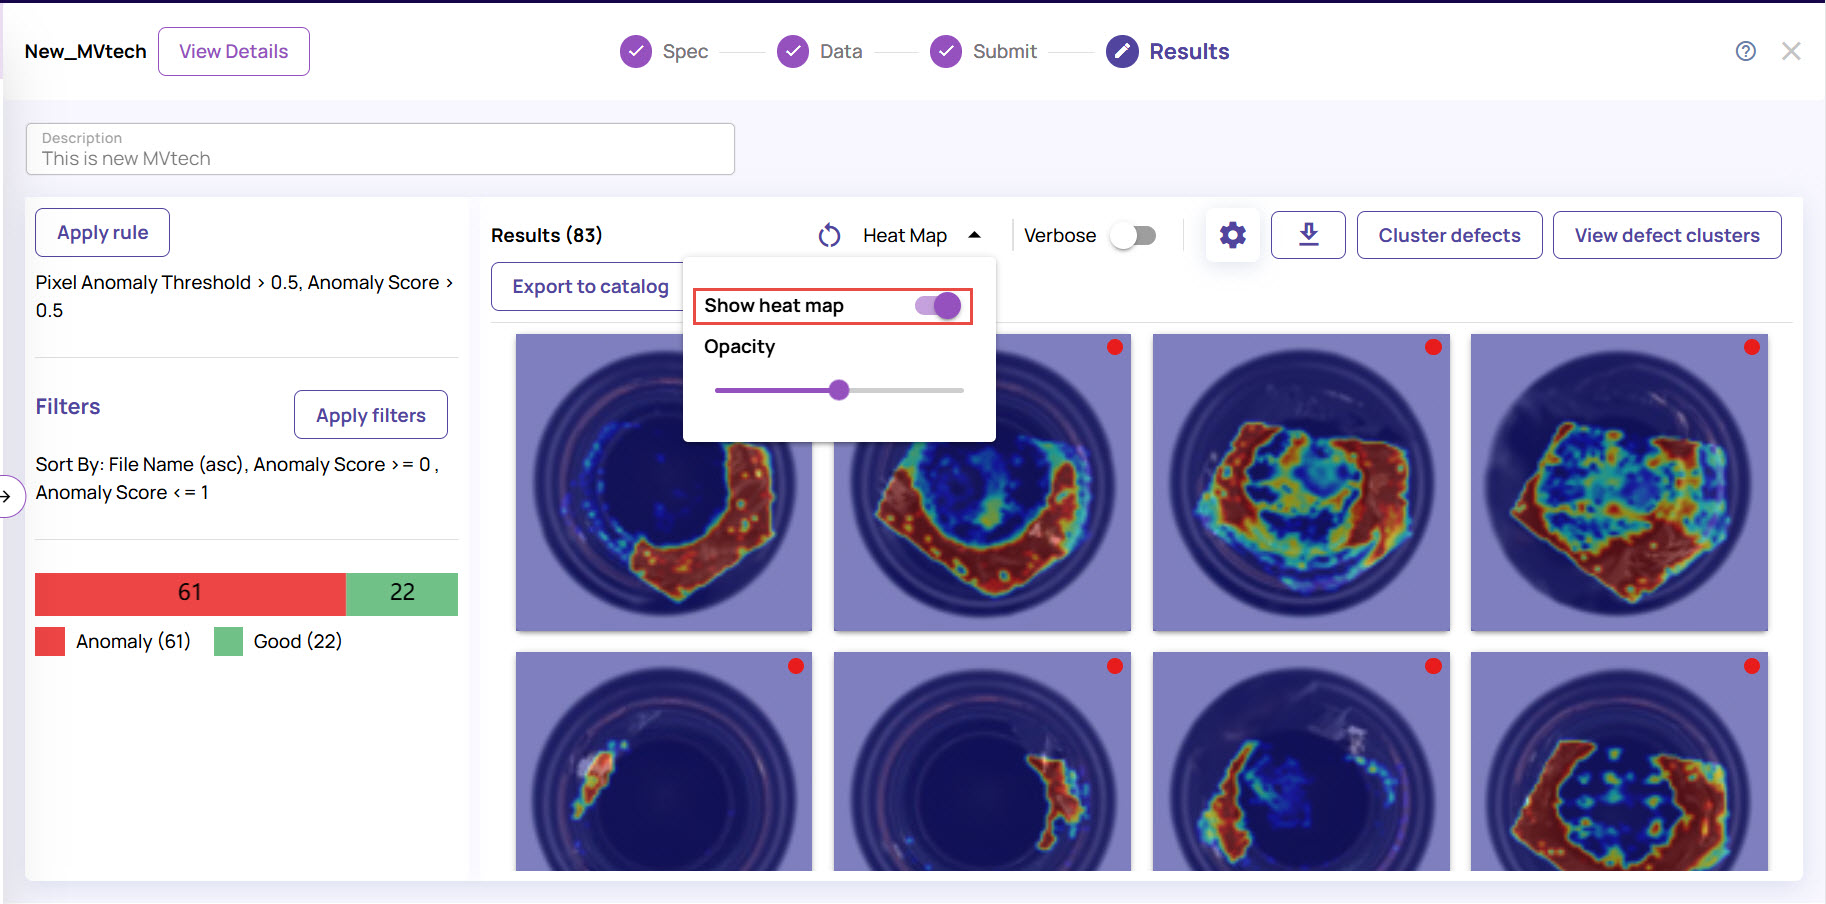
Enable Verbose to view the image file information.
Enable Show Distribution to view the distribution of anomalies in graphical format.
Download anomaly attributes
Once the anomaly results are generated, you can download the attributes as JSON or CSV file.
Click the download icon appearing adjacent to the settings icon.
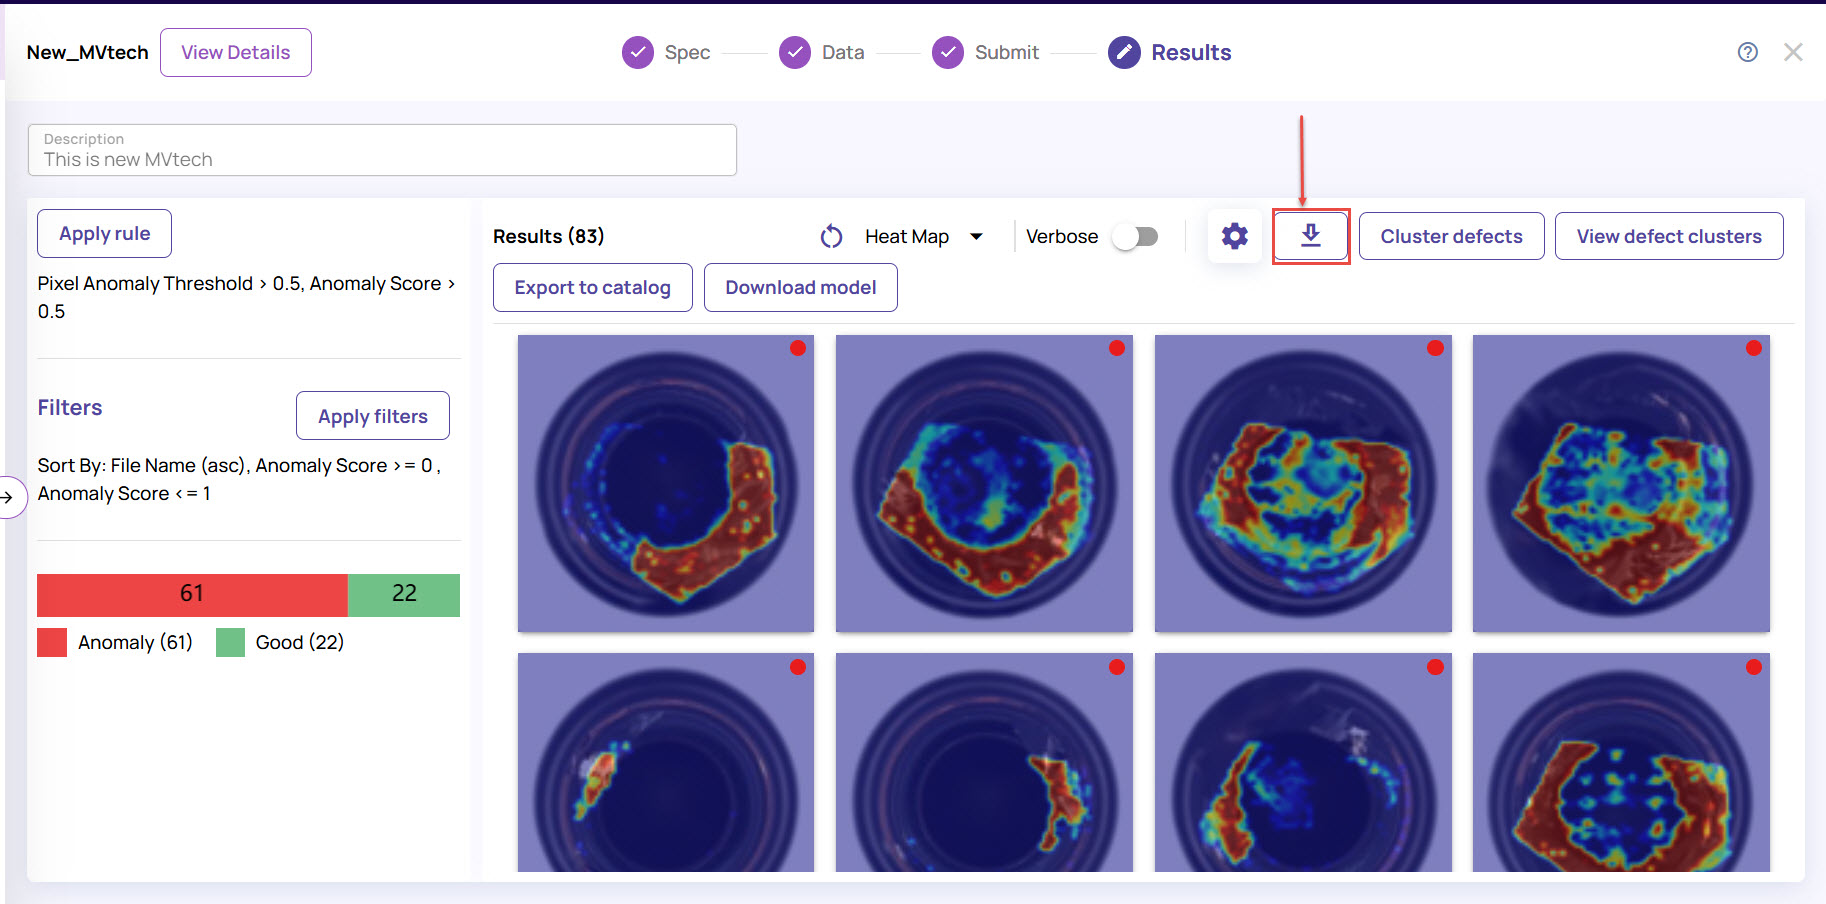
Select JSON or CSV from the drop-down list and click the Download button.
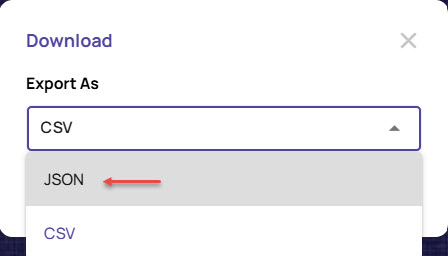
The anomaly attributes are exported in the selected file format.
Filter anomaly results
Click the filter icon to filter the results based on different parameters.
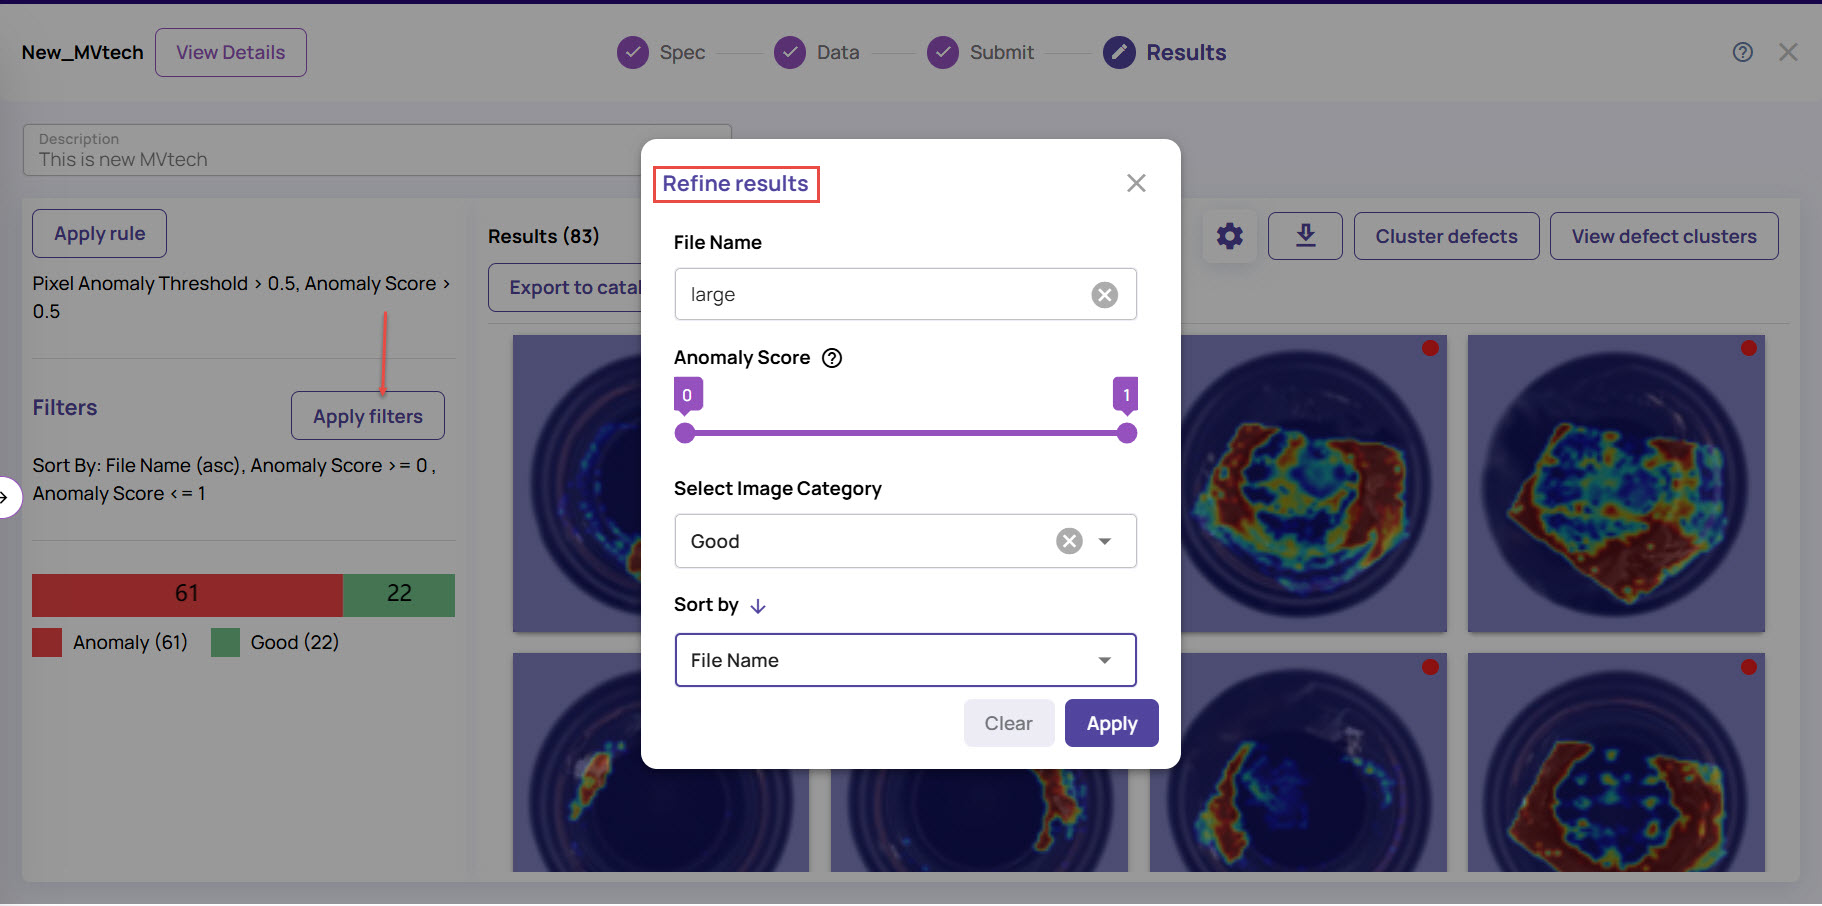
Specify the file name, based on which you want to refine the results.
Select the Anomaly score by sliding the anomaly bar between 0 and 1.
Select Image Category as Anomaly, Good images or All images.
Select the option to sort the images, for example, sort by File Name. You can also click the down arrow or up arrow to sort in ascending or descending order, respectively.
Specify Advanced Filter options, like Pixel Anomaly Percentage, Max and Min Blob sizes.
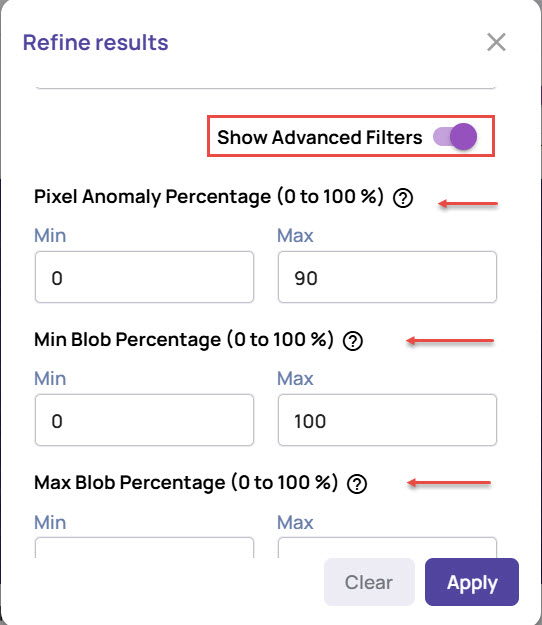
Click the Apply button to filter the anomaly results based on the specified parameters.
View high-resolution anomaly images
The full-resolution image displays the path of the image, along with the attributes based on which the anomaly has been detected.
Click an image from the Results tab to view the test image with and without a heatmap side by side.
This helps to analyze the anomalies detected and take necessary actions.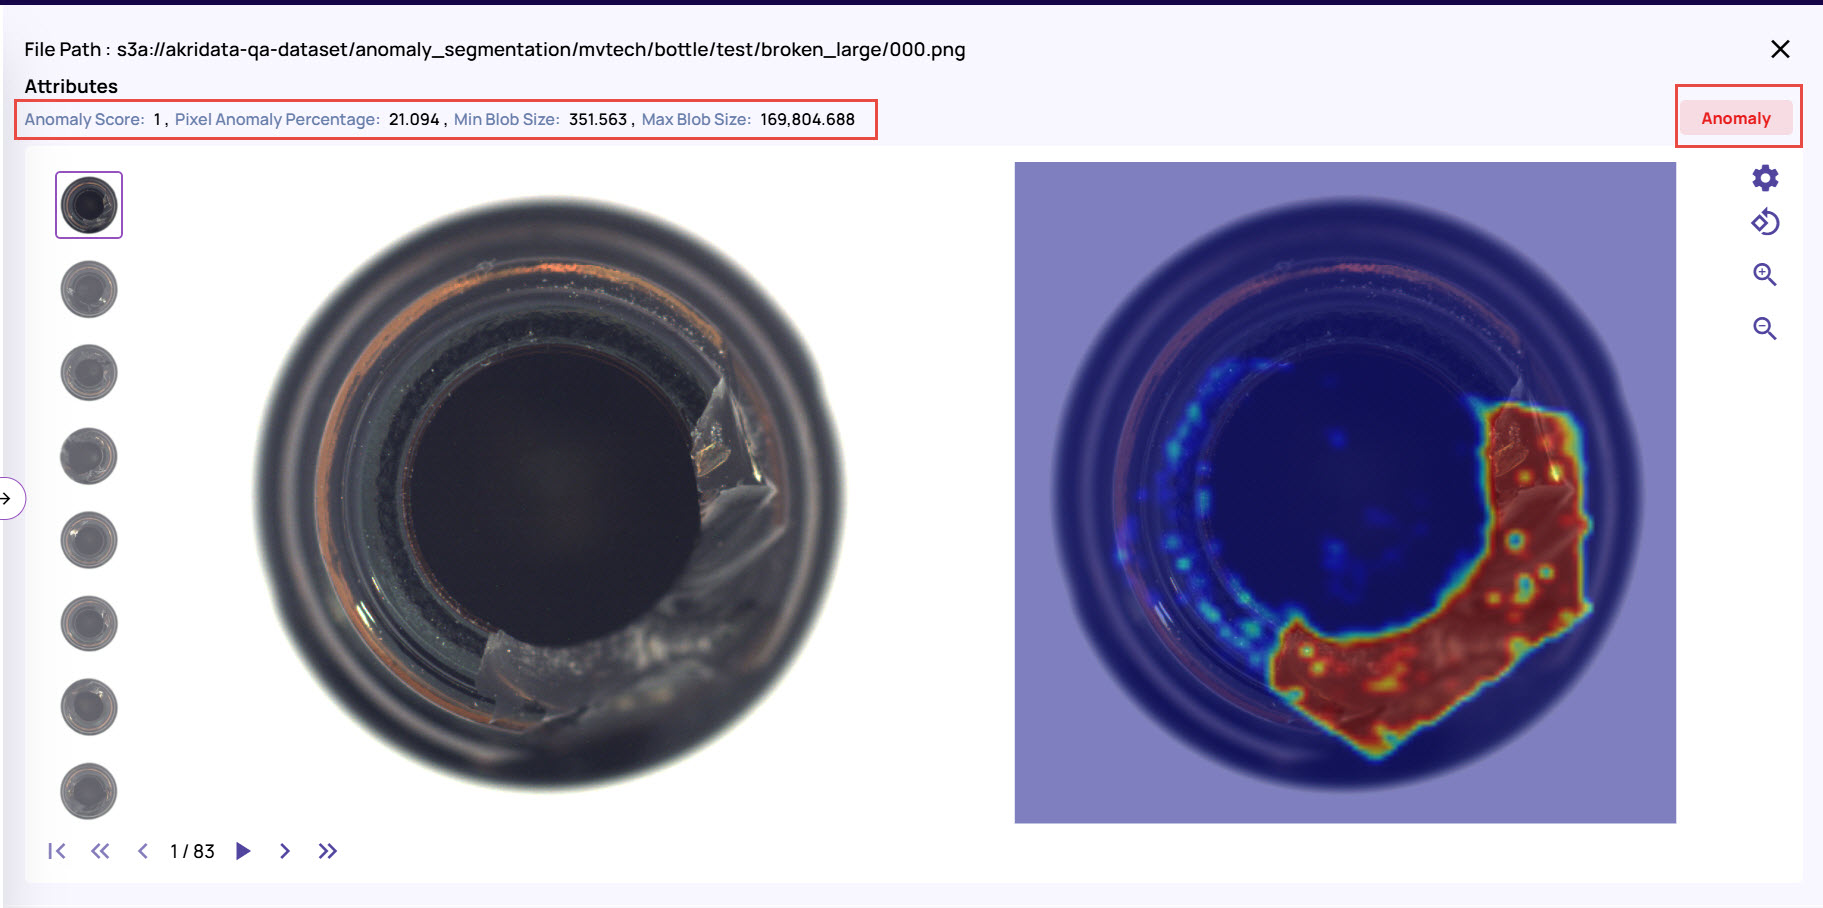
Click the Settings icon on the top-right corner to view or hide the heatmap image.
The images are indicated as Anomaly or Good on the top-right corner, as shown.Click the icons to view the images as shown in the image:
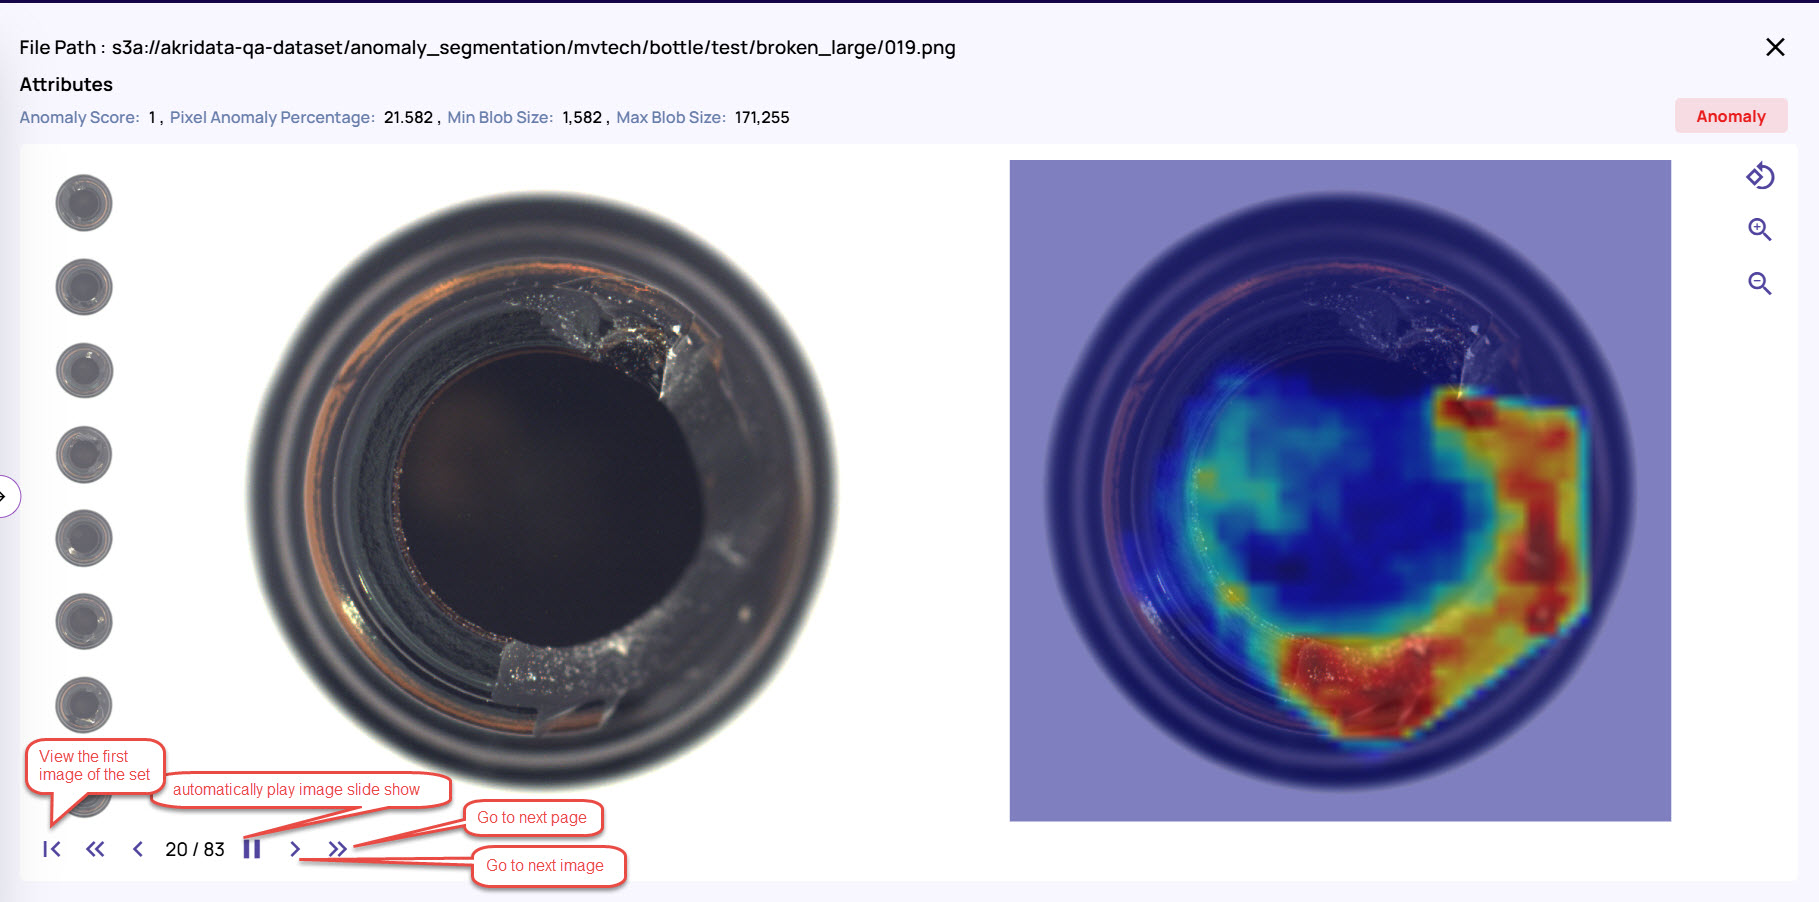
Play icon: To display the images one after the other automatically with the heatmap.
Single arrowhead icon: To move to the next slide or previous image.
Double arrowhead icon: To move to the first image on the next page.
Left-most icon: To move to the very first image of the image set.
Click the rotate icon to view the image in landscape or portrait mode, as needed.
By default, the images are displayed in landscape view. Click the rotate icon to change to portrait view.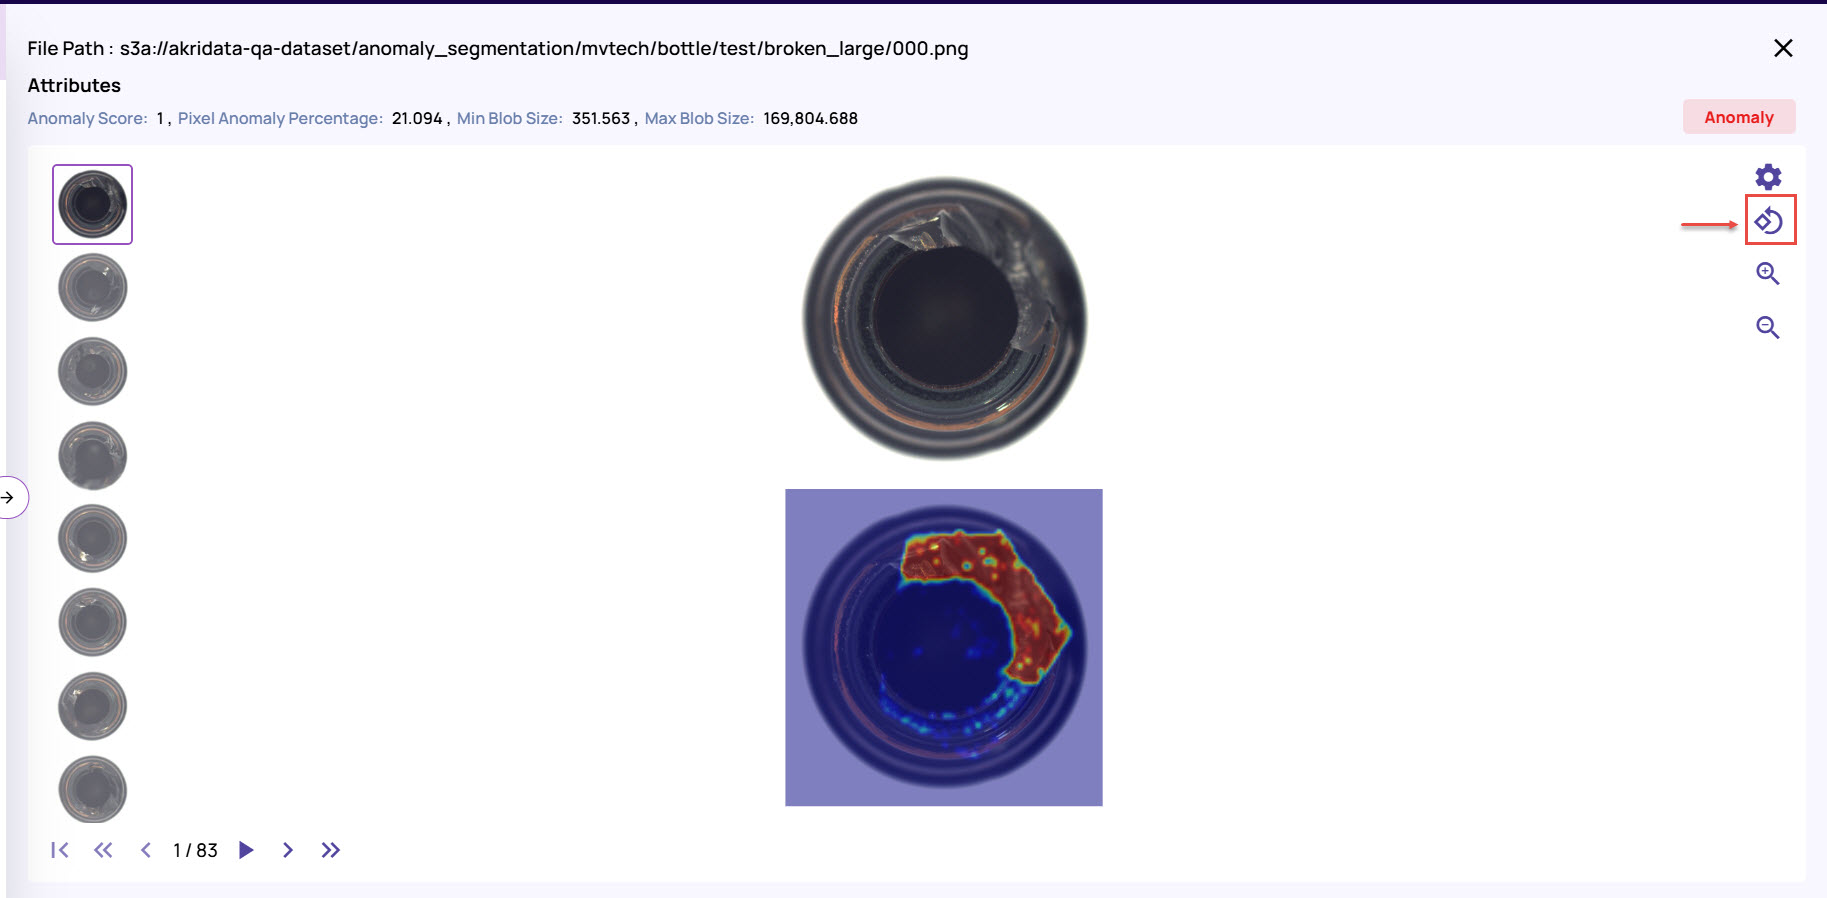
Zoom in or out the images for better visibility, as needed.
Custom post-processing rules
Post-processing rules allow custom conditions that can be applied to categorize an image as an anomaly.
Apply a new rule
Click the Apply Rule button on the left to define the post-processing rule.
.jpg)
Modify the pixel anomaly threshold as needed. The ‘pixel anomaly threshold’ determines the anomaly value above which a pixel is considered anomalous. The other rule conditions specify how anomalous pixels are used to determine whether the image is an anomaly. The conditions available are
Pixel anomaly percentage: Percentage of pixels in the image that qualify as an anomaly.
Min/Max blob size: An anomaly blob is a contiguous group of anomalous pixels. These conditions enable the specification of the anomaly blob size in terms of pixels.
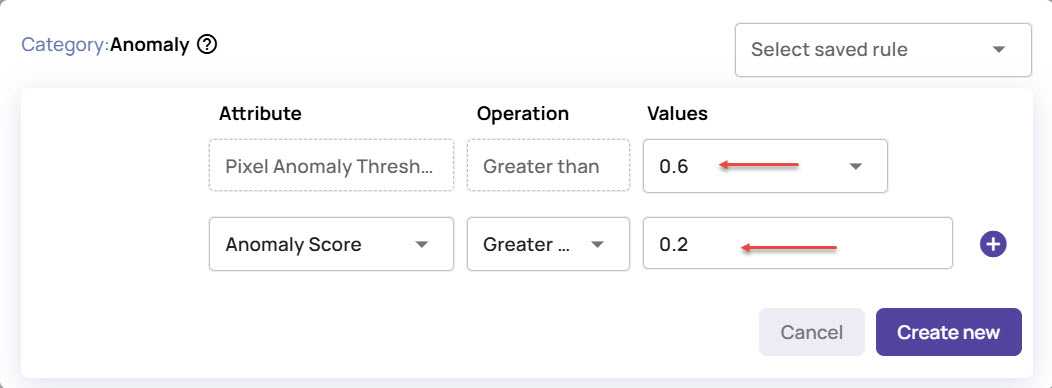
Click Create New. The rule executes and the results will be refreshed based on the applied conditions.
.jpg)
Click the Save Rule button adjacent to the Apply Rule button and enter a Name and Description for the rule.
Click Save to save the rule.
.jpg)
You can view all the saved rules under the Select saved rule, next time when you create a new rule from the Apply Rule button.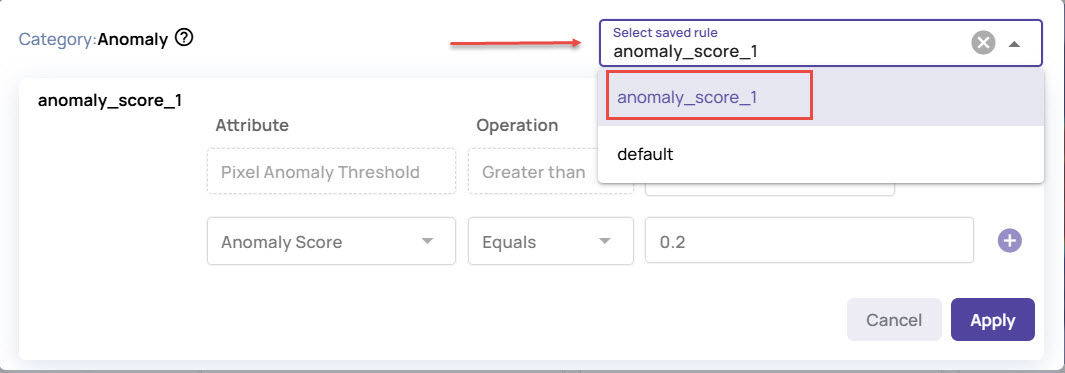
When selecting an existing rule, the parameters are automatically filled based on the values in the saved rules.