This type of job analyzes object detection model output, which has class, bounding box, and confidence.
Catalog
This type of job requires the following fields to be present in the catalog.
Ground truth class(string) (gt_class)
Ground truth bounding box(string) (gt_box) - The ground truth bounding box can be provided in one of the following forms.
JSON with [0-1] normalized coordinates.
The string should be formatted as a JSON with x_left, x_right, y_top, and y_bottom.
All key values must be normalized between 0 and 1 using the width and height of the image.
For example {'x_left': 0.5, 'y_top': 0.75, 'x_right': 0.7, 'y_bottom': 0.95} represents a valid bounding box.
Normalized coordinates in four individual catalog columns.
Absolute coordinates in four individual catalog columns, and image height and width in two separate columns.
Bounding boxes in COCO and YOLO formats
Predicted class(string)(pd_class)
Prediction bounding box(string) (pd_box) - Same format as ground truth bounding box
Prediction confidence score(float) (pd_score)
Below is a sample catalog table with ground truth and predictions for a single image. The file_path or file_name column is required to correlate(join) this table with one of the pipeline-generated tables. The below sample table captures a model output where car and bus classes are correct predictions, and train is a wrong prediction on an image 1.jpg
file_path | gt_class | gt_box | pd_class | pd_box | pd_score |
|---|---|---|---|---|---|
1.jpg | car | {'x_left': 0.5, 'y_top': 0.75, 'x_right':0.7,'y_bottom': 0.95} | |||
1.jpg | bus | {'x_left': 0.2, 'y_top': 0.3, 'x_right':0.8,'y_bottom': 0.75} | |||
1.jpg | car | {'x_left': 0.55, 'y_top': 0.70, 'x_right':0.6,'y_bottom': 0.92} | 0.7 | ||
1.jpg | bus | {'x_left': 0.25, 'y_top': 0.32, 'x_right':0.75,'y_bottom': 0.7} | 0.5 | ||
1.jpg | train | {'x_left': 0.2, 'y_top': 0.2, 'x_right':0.5,'y_bottom': 0.5} | 0.2 |
Note:
If an object has multiple ground truth and prediction labels, each row in the catalog should specify one ground truth or one prediction label.
The ground truth label and ground truth bounding box should be in the same row.
The prediction confidence and bounding box should be in the same row as the prediction label.
The above catalog must be loaded into a table using instructions in Quick Import catalog
Create a view
Before creating an analyze object detection job, the catalog with ground truth and prediction information must be joined with one of the pipeline tables using a view. To create a view, follow the steps in the guide below.
Other types of virtual columns
The guide above defined a bounding box using AKD_BoundingBoxJSON, which is a type of virtual column that takes a JSON string with normalized coordinates for the four corners of a bounding box. Below is a list of alternate virtual column types available to define a bounding box. Once the bounding box is defined, the AKD_2DBoundingBoxGT and AKD_2DBoundingBoxPred virtual column types must be used to define a ground truth and prediction, respectively.
Virtual column type | Inputs |
|---|---|
AKD_2DBoundingBox | 4 individual columns with [0:1] normalized coordinates for 4 corners of the bounding box |
AKD_2DBoundingBoxAbs | 4 individual columns with absolute coordinates with image height and image width as separate columns |
AKD_2DBoundingBoxCOCOJSON | If the catalog is imported using COCO JSON, the bounding box is represented as a list of four absolute values (x_left, y_top, width, height). This virtual column type takes this list of four values in a column along with image height and width in two separate columns. |
AKD_2DBoundingBoxYOLO | If the catalog is imported in YOLO format, the bounding box is imported as four individual columns with [0:1] normalized values for (x_center, y_center, width, and height). This virtual column type takes these four columns as input. |
Create a job
Create an analyze object detection job by following the steps in the guide below.
Visualize job
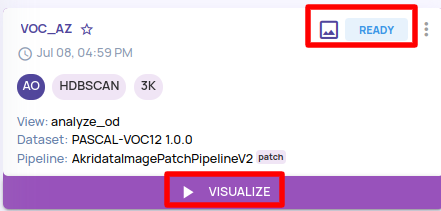
Once the job is in READY state, click on the VISUALIZE button as shown below.

Statistics panel
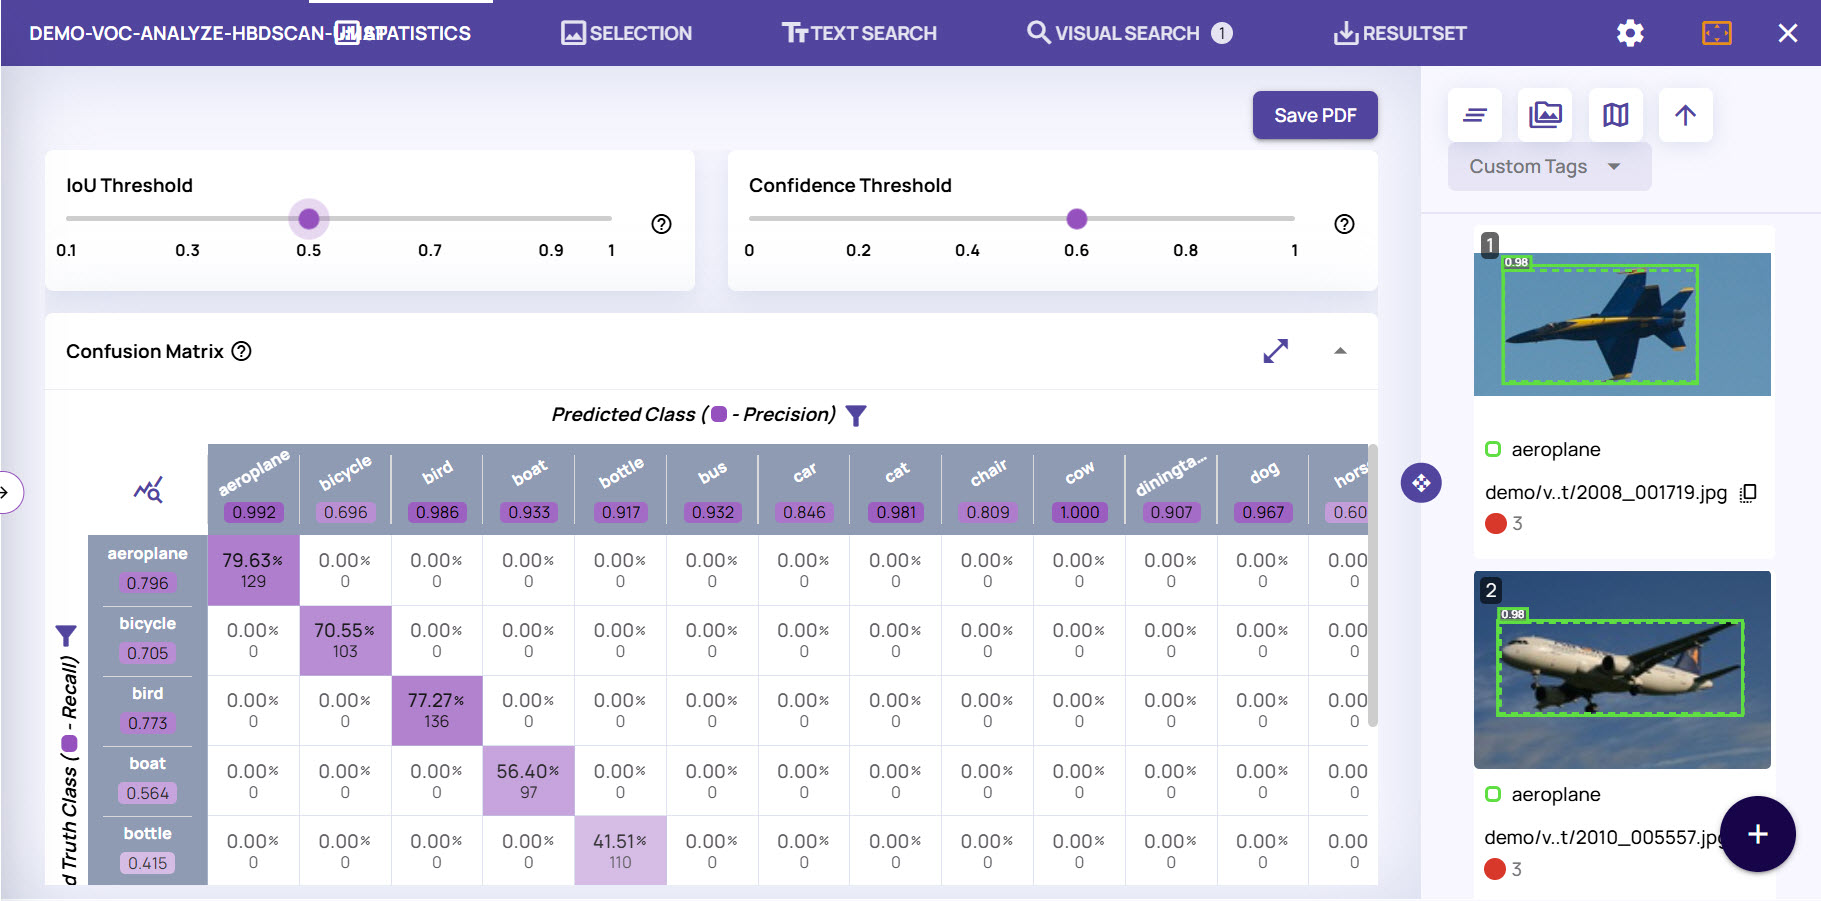
The numbered elements on the screenshot of the statistics panel are described below.
IOU threshold: A slider to adjust the Intersection-over-Union(IOU) threshold of the prediction to consider it to match the ground truth. Changing the IOU threshold updates the confusion matrix and the precision-recall curve.
Confidence threshold: A slider to adjust the confidence threshold of the prediction to consider it to match the ground truth. Changing the confidence threshold updates the confusion matrix and the precision-recall curve.
Action bar: The icons on the action bar from right to left are
Show images: After selecting any column/row/cell in the confusion matrix, the ‘Show Images’ icon will populate the right panel with thumbnails corresponding to the selected cell(s) in the confusion matrix.
Show plot: Shows the points of the selected column/row/cell in a plot view.
Clear selection: Clear selected column/row/cell.
Confusion matrix: The confusion matrix shows the break-up of object counts for each ground truth Vs prediction combination. The row legend shows the precision value, and the column legend shows the recall value at the IOU and confidence thresholds selected by the sliders described earlier.
Custom tags: Add custom tags to images for effective analysis of set of images sharing the same image tag. Refer to Image Tagging for more information.

The precision-recall curve shows the precision and recall values for the chosen IOU threshold and each confidence threshold in the slider. The precision and recall values for the currently selected confidence threshold are highlighted by the larger dot in the chart. The left panel allows viewing precision-recall values for an individual class. The left panel also shows the F1 score at the current chosen confidence threshold.
.png)
The IOU Vs. confidence histogram shows the distribution of predictions for each range of IOU and confidence. The average IOU confidence score is presented on the left panel, and a higher score indicates a larger percentage of high IOU and high confidence predictions, indicating good model behavior. The left panel also allows drilling down on an individual class.
.png)
The video below demonstrates the statistics panel's capabilities.