Analyze classification type of job is used to analyze a single class classification model.
Catalog
This type of job requires the following catalog fields to be present in the catalog.
Ground truth class (string)
Predicted class (string)
Prediction confidence (float)
Below is a sample catalog table with ground truth and predictions for a single image. The file_path or file_name column is required to correlate(join) this table with one of the pipeline-generated tables.
file_path | ground_truth | prediction | confidence_score |
|---|---|---|---|
sdnet/Walls/Cracked/7069-154.jpg | cracked | ||
sdnet/Walls/Cracked/7069-154.jpg | cracked | 0.809 | |
sdnet/Walls/Cracked/7069-154.jpg | non-cracked | 0.191 |
Note:
Ground truth and prediction must be imported to the catalog as 2 separate rows, with each prediction in its own row.
Only one ground truth per image is supported.
The prediction and corresponding confidence score must be present in the same row.
The above catalog must be loaded into a table using instructions in Quick Import catalog
Create a view
Before creating an analyze classification job, the catalog with ground truth and prediction information must be joined with one of the pipeline tables using a view. To create a view, follow the steps in the guide below.
Create job
Create an analyze classification job by following the steps in the guide below.
Visualize job
Once the job is in READY state, click on VISUALIZE button as shown below.
.png)
Statistics panel
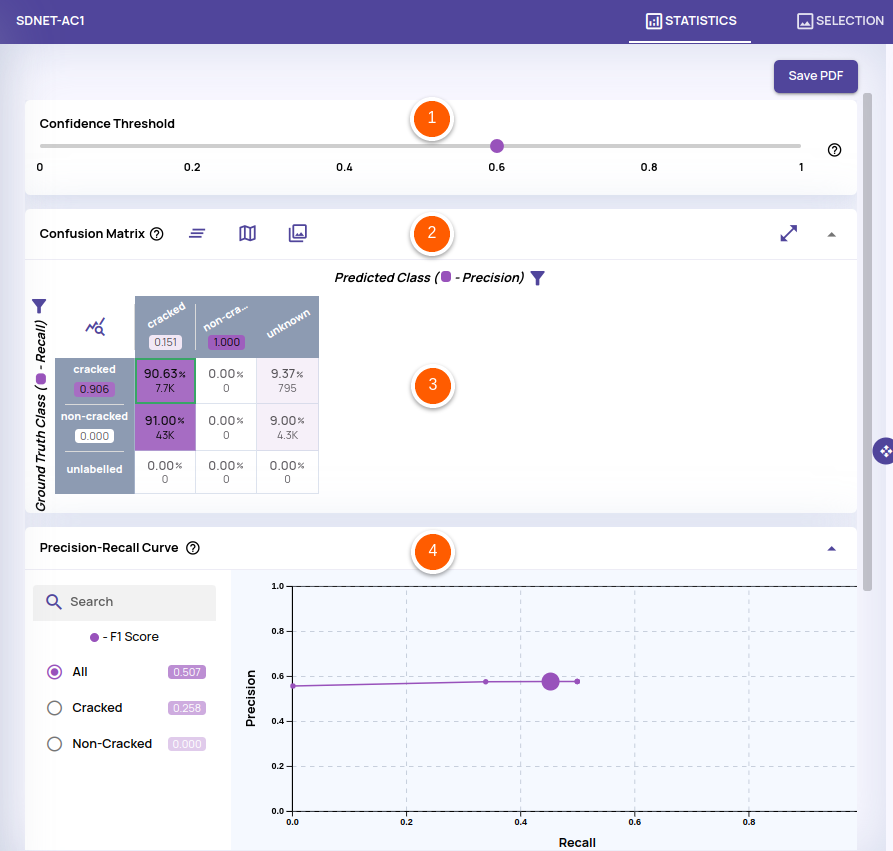
The numbered elements on the screenshot of the statistics panel are described below.
Confidence threshold: A slider to adjust the confidence threshold of the prediction to consider it to match the ground truth. Changing the confidence threshold updates the confusion matrix and the precision-recall curve.
Action bar: The icons on the action bar from right to left are
Show images: After selecting any column/row/cell in the confusion matrix, the ‘Show Images’ icon will populate the right panel with thumbnails corresponding to the selected cell(s) in the confusion matrix.
Show plot: Shows the points of the selected column/row/cell in a plot view.
Clear selection: Clear selected column/row/cell.
Confusion matrix: The confusion matrix shows the break-up of counts for each ground truth Vs prediction combination. The row legend shows the precision value, and the column legend shows the recall value at the confidence threshold the slider described earlier selected.
Precision recall curve: The precision-recall curve shows the precision and recall values for each confidence threshold in the slider. The precision and recall values for the currently selected confidence threshold are highlighted by the larger dot in the chart. The left panel allows viewing precision-recall values for individual classes. The left panel also shows the F1 score at the current chosen confidence threshold.
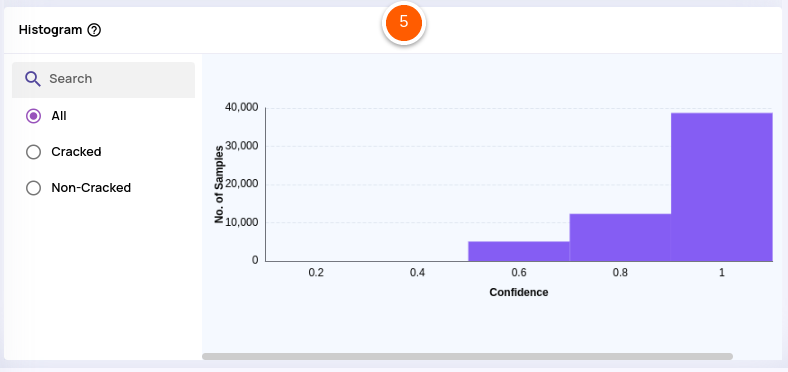
Per confidence histogram: The chart shows the breakup of samples across different confidence threshold ranges. The left panel provides filtering on individual classes. Each bar in the histogram is selectable for viewing the images or plot view of the samples corresponding to that bar.


The video below demonstrates the statistics panel's capabilities.