Vision Command is a comprehensive suite designed to capture data and model inferences from an inspection endpoint and centralize it on the cloud for monitoring, analytics, and downstream operations like labeling, model training, etc.
Refer to the following video to learn about Vision Command features.
Concepts
.png)
The above diagram depicts the schematic representation of a factory as modeled in Vision Command.
A factory consists of one or more lines.
Each line has one or more stations through which the manufactured part flows as part of its assembly and quality inspection process.
A station can be equipped with one or more cameras to capture images.
The images are captured by an ‘IO container’ module and sent to an ‘Inference container’ module (hosted on-prem or cloud) for real-time quality inspection. Additionally, the captured data is shipped to a dataset.
Corresponding stations across identical lines are expected to have an identical inference task and produce identical/relatable data. Based on this observation, identical stations across identical lines can be grouped to form a station group and associated with a dataset for efficient management.
IO container and Inference container modules are custom for your use case. Please contact Akridata support for more details.
Click Vision Command on the top bar.
.jpg)
The Vision Command page has four different icons in the left navigation panel: Dashboard, Factories, Station Groups and Analytics.
Dashboard
This is the default page on the Inspection Studio screen. The dashboard provides a quick overview of the health status and activity metrics from all the monitored stations.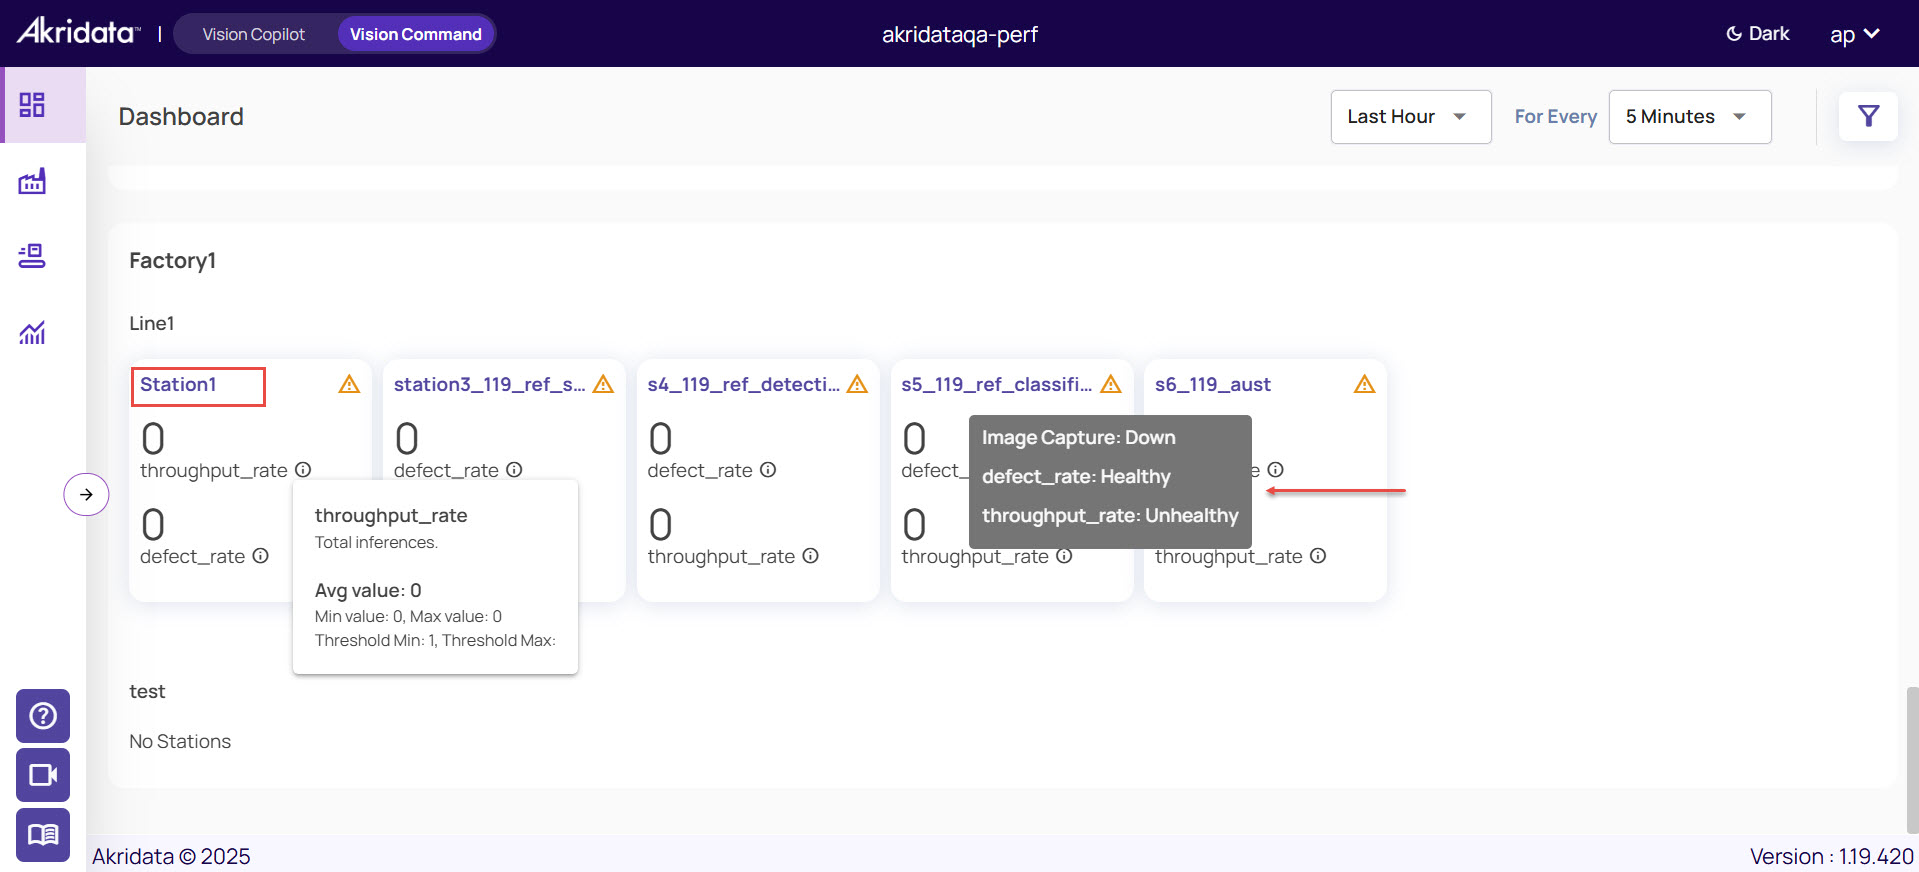
Set Time Range
You can view the stations with the data for a selected period of time from the time range drop-down in the top right corner. By default, the details are shown for Last Hour.
Click the drop down to change the time range from the list of options.
To set custom time range, click the drop-down shown on the time range, and select Custom.
In the Pick Time Range window, set the time range based on the period you want to view the data, and click Apply.
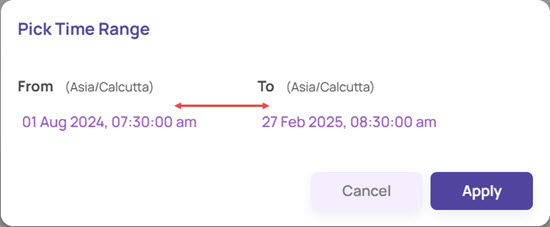
The Dashboard will display the results based on the specified time range.
Use Filter
If you have many factories and sessions on the dashboard, you can filter for the station based on the factory location.
Click the filter icon on the top-right corner of the screen.
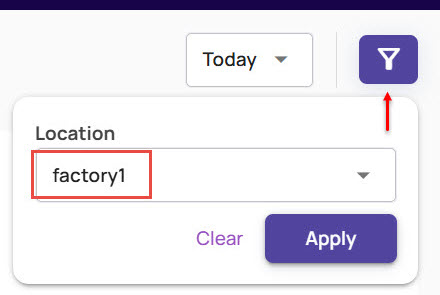
Under Location, select the factory from the list of factories, and click Apply.
Additionally, you can click on any station to view the Station Dashboard to drill into station-specific details.
Factories
This page displays all the factories you would create with lines and stations. .jpg)
You can edit or delete a factory, add new factories, and view the page for a selected factory to add one or more lines. Each station displays real-time metrics. The current metrics displayed are
throughput_rate: The image capture rate and inferences over time.
defect_rate: Defect rates over time.
Station Groups
This page allows you to create new station groups, add stations, and manage various activities for the station group. 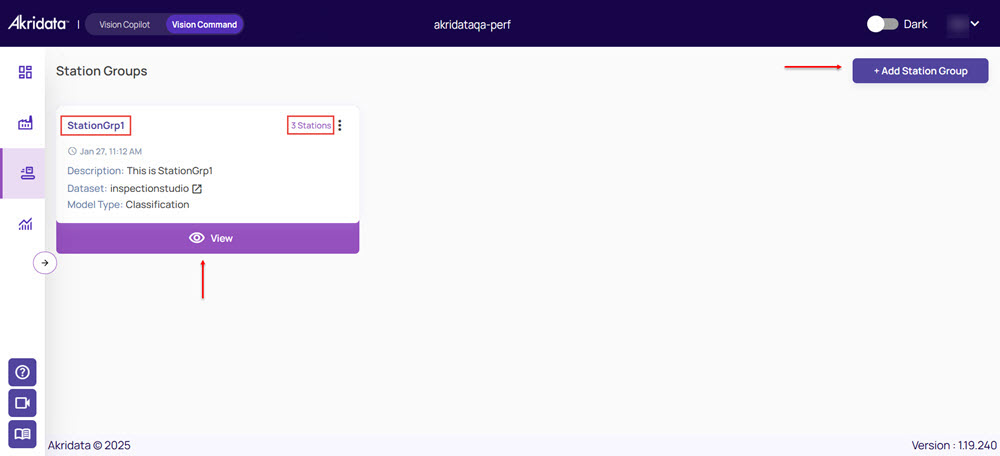
You can create one or more station groups if you have more than one station and want to run the inspection on a set of stations.
Analytics
Click the Analytics icon on the left navigation pane to open the Analytics page to run ad-hoc analytics queries on your inspection data..jpg)
This page displays the analytics of the station group data based on specified parameters. You can view analytics on defects and the throughput rate of images ingested for a station. You can also compare the data between two stations at a given point.