The 'Visualize' operation displays the visualization view, which includes the following elements and controls.
Plot View and Sampling Modes
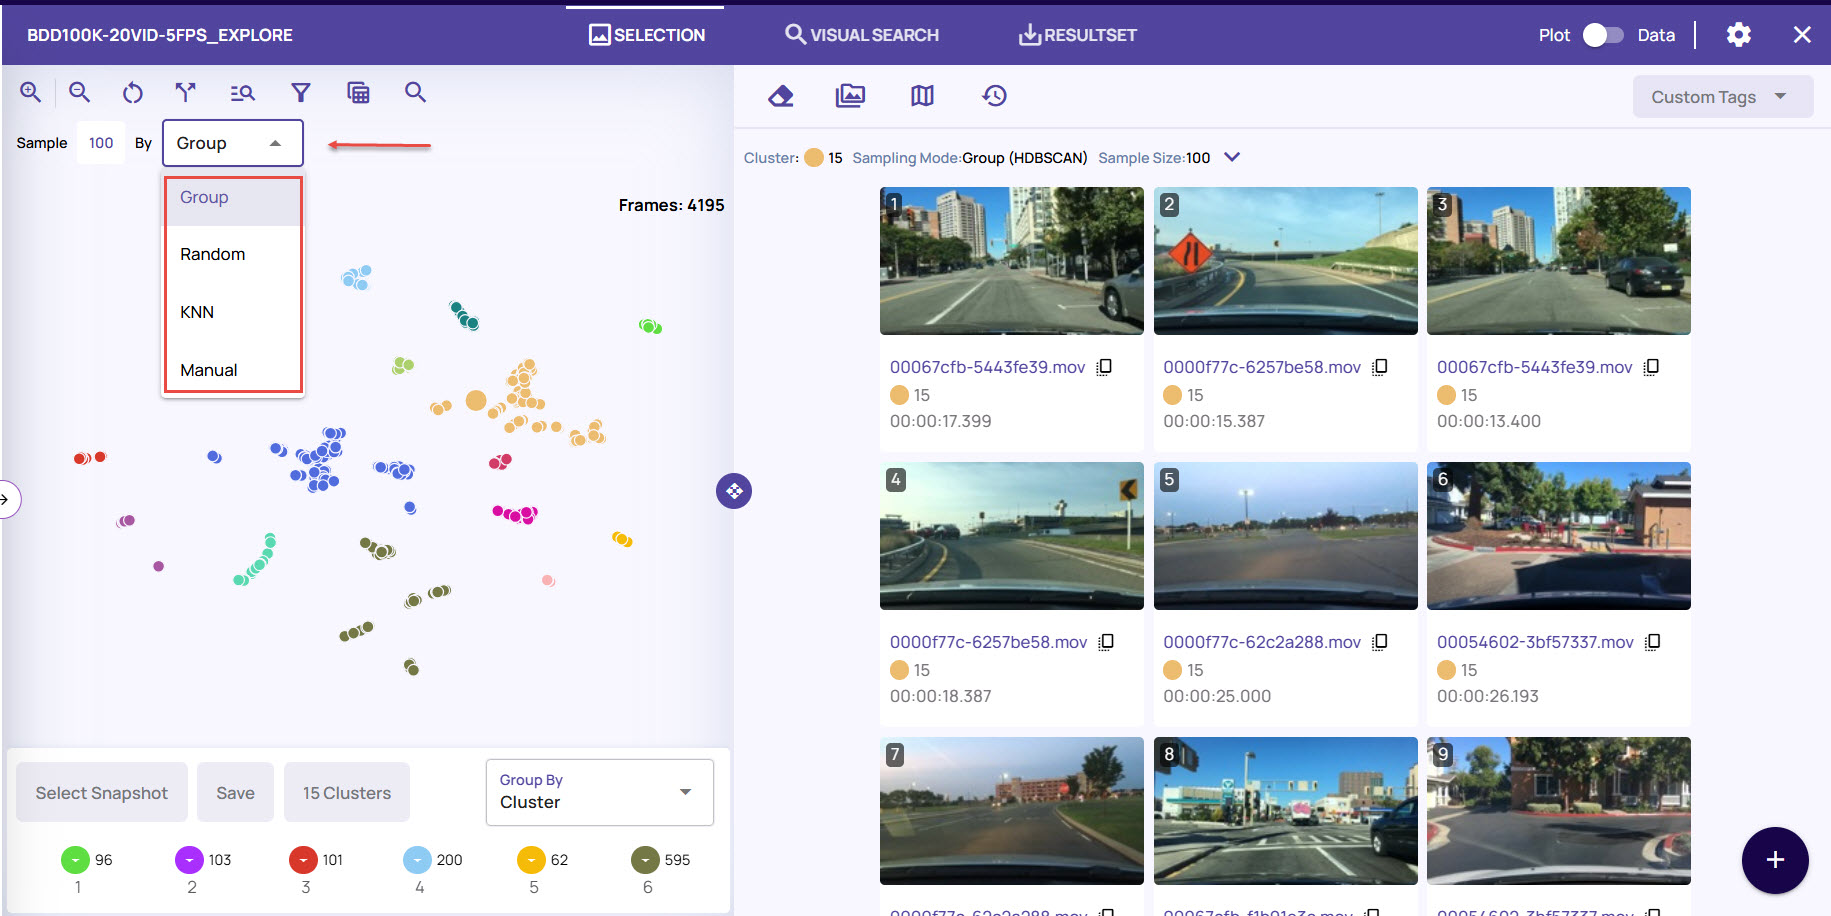
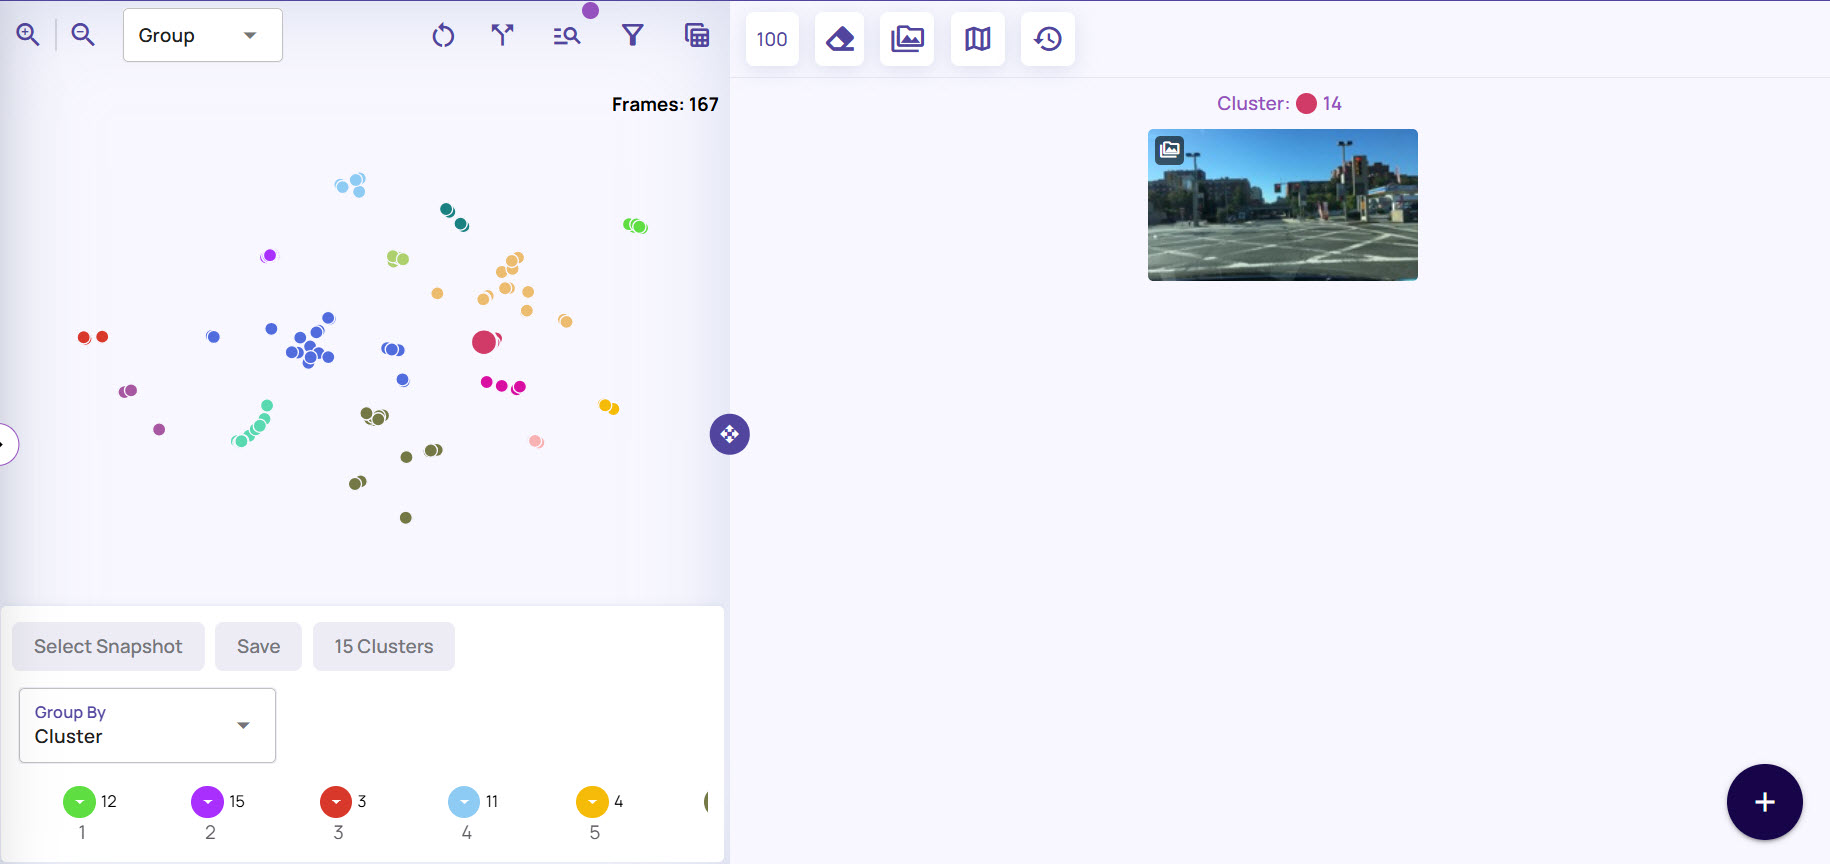
The plot view displays the distribution of points, with colors representing the clusters and an outlier category for points that don't belong to any cluster. Each point in the plot view is clickable, and this action populates the right 'Selection' panel with sampled points related to the clicked point. The plot view supports zooming in and out and panning to focus on the most relevant area that contains the data points of interest. The points can be sampled using the following modes,
Group - Uniform distribution of points from the group to which the clicked point belongs is sampled. The grouping criteria are determined by the 'Group by' option in the bottom-left selection.
Random - A random set of points is sampled.
KNN - Nearest neighbors around the clicked point are sampled.
Manual - The clicked point is sampled.
Selection (thumbnail) Panel
The right panel shows the sampled thumbnails and has the following controls,
Sample size setting - Controls the number of points sampled in response to a click in plot view.
Clear points - Clear points from the selection panel.
Highlight points - Highlight points in the plot view corresponding to thumbnails in the selection panel.
.png)
Each thumbnail has an action bar with the following actions(from left to right),
Remove this point from the selection.
Show catalog tags (only available for Analyze type of job)
Add to the similarity search as a positive sample.
Add to the similarity search as a negative sample.
Show a full-resolution image for this thumbnail.
Add to resultset
Detailed View
A detailed view shows a full-resolution image. Additionally, catalog information is presented alongside each image to analyze the types of columns used, as shown below.
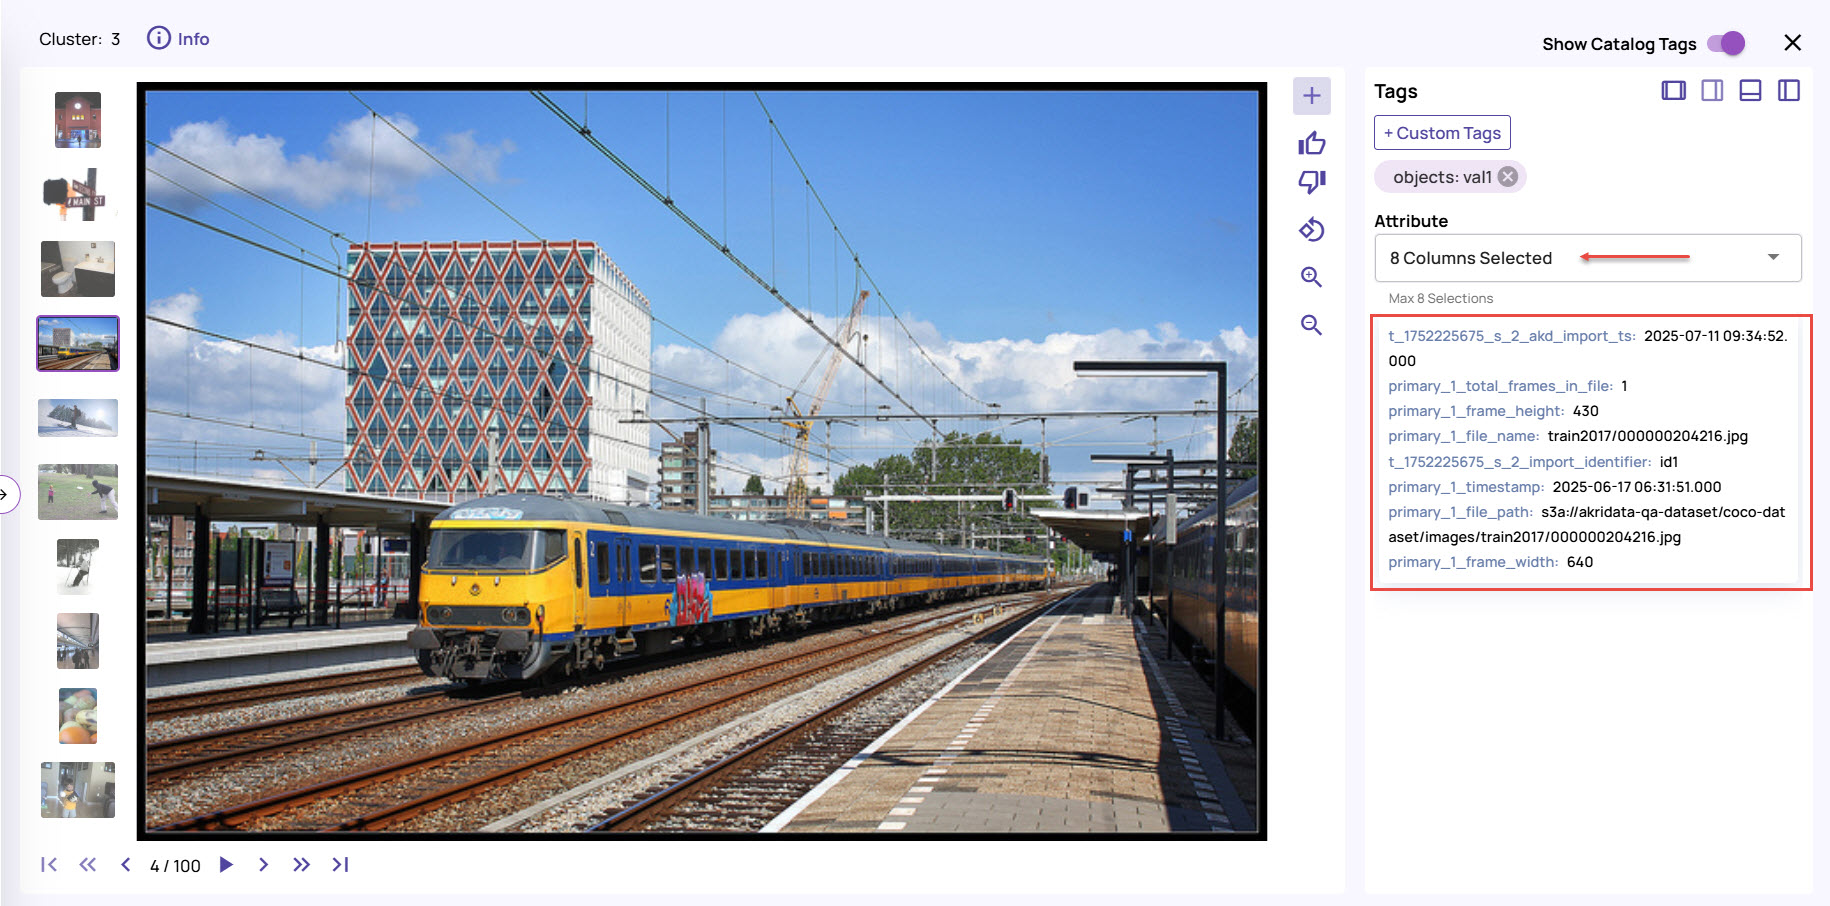
Image Tagging
In the visualization page's detailed view, you can tag images with custom tags. The tags can be used as filters and exported to a catalog or downloaded through a result set. You can remove the tags at any time if they're not necessary. For setting and removing custom tags and to know their various uses, refer to Image Tagging.
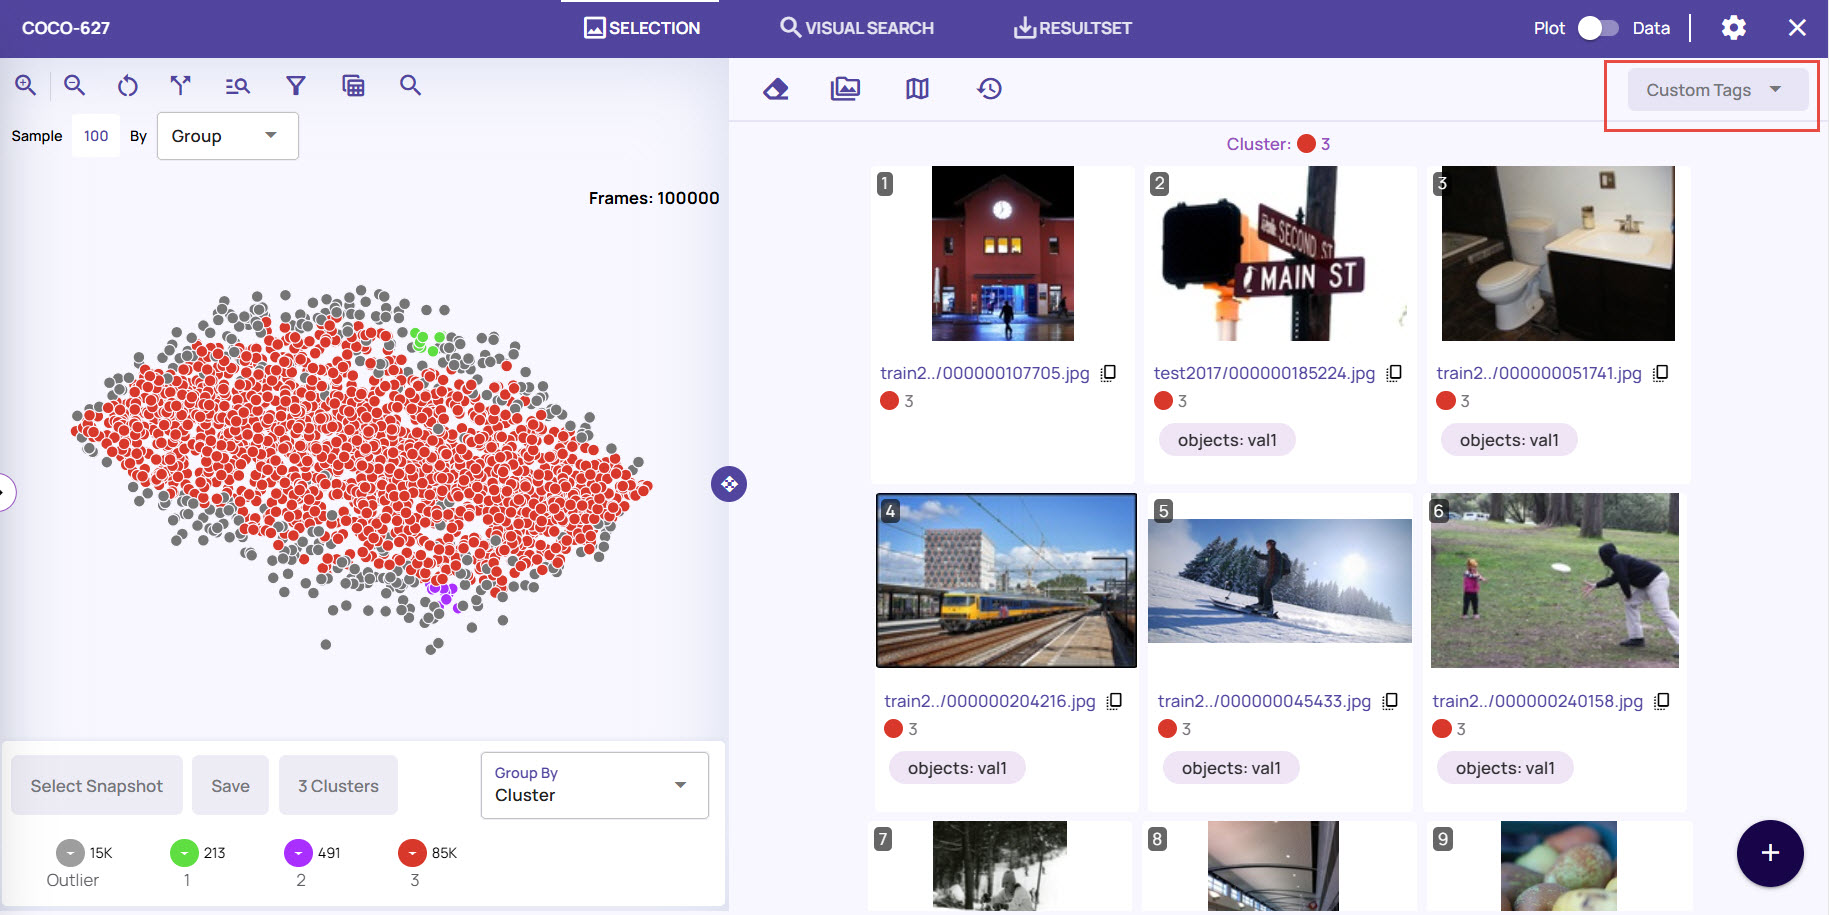
Image Options
In the full-resolution view, you can use the image's various options.
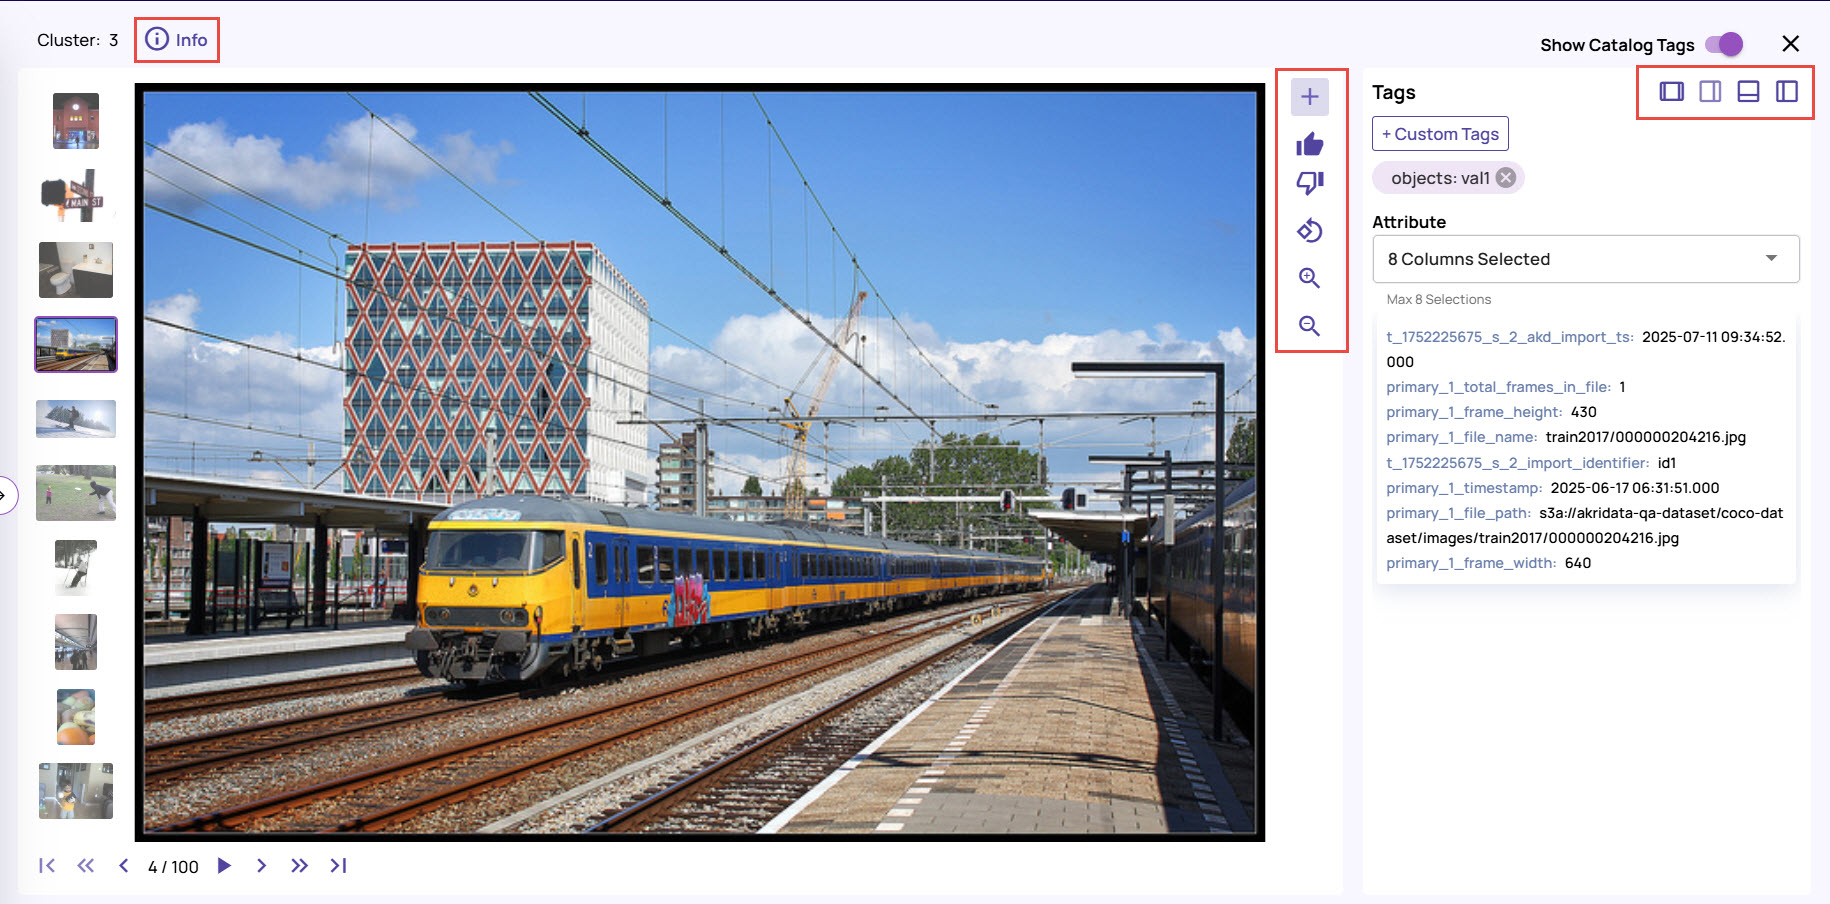
File attributes: Click the info icon on the top-left corner to view the file attributes associated with the image.
Accept or reject image: Click the thumbs-up or thumbs-down icons to the right of the image to accept or reject the image after analysis.
Zoom in/Zoom out: Use the zoom options to take a deeper insight into the image for analysis.
Dock options: Use the dock options to position the Tags panel where it's most convenient for your viewing.
Group-by (Color-by)
The bottom left of the view has a Group-by option to color the points in the plot view based on the following attributes,
Cluster (HDBSCAN): Cluster id to which point belongs.
Confidence: The algorithm's confidence in assigning a point to a cluster.
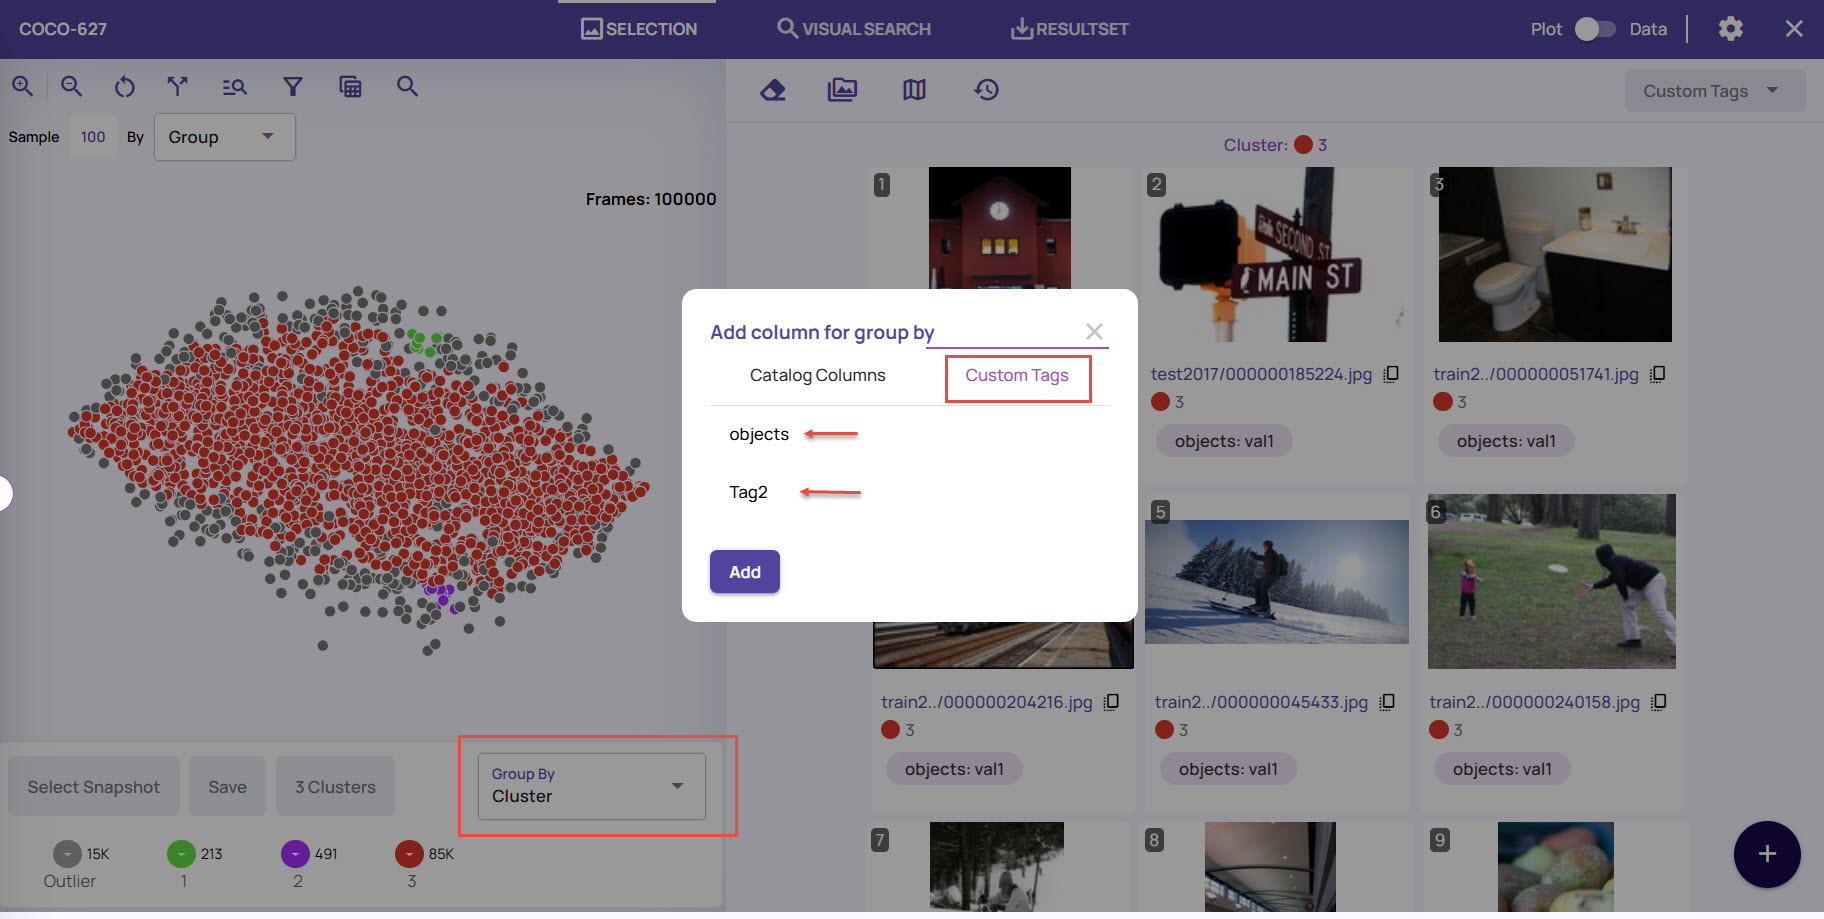
Add Column: Click this option to view the columns that are supported. You can add columns from the filtered list of columns under the Catalog Columns tab. If you added custom tags to the images, you can use a group based on those tags to view the results.
Tunables
The tunables button provides the following controls to filter the points in the plot view,
Sampling modes- The following probabilistic sampling modes are available,
Inlier - Points that are strong inliers to some clusters.
Outlier - Points that don't belong to any cluster.
Bimodal - Points that are either strong inliers or outliers.
Normal - Sample points using a normal distribution.
Uniform - Sample 1 every N points, with N decided by the sampling fraction. This is most useful to sample every N points on time-ordered data.
Coreset - Sample point in a way that preserves the clustering structure
Sampling fraction - Fraction of total points to be sampled.
Sampling weight—How strongly the preference must be given to the selected sampling mode. The higher the number, the stronger the preference.
The following picture shows sampling with the Group-by option selected as Cluster, where points are colored by confidence scores. Since the sampling weight was set to the highest allowed value (indicating a strong preference for sampling mode), inlier sampling chooses points with high confidence scores, and outlier sampling chooses points with low confidence scores.
Ksegmentation-Specific Sampling Modes
Edge - Points that are at cluster boundaries, representing transitions.
Line - A regression line (trendline) for each cluster is drawn, and this sampling mode prefers points close to this line.
Core - Points that are away from the cluster edges.
Other Explore Job page options
The Explore Jobs page provides options to interact with the frames, as needed.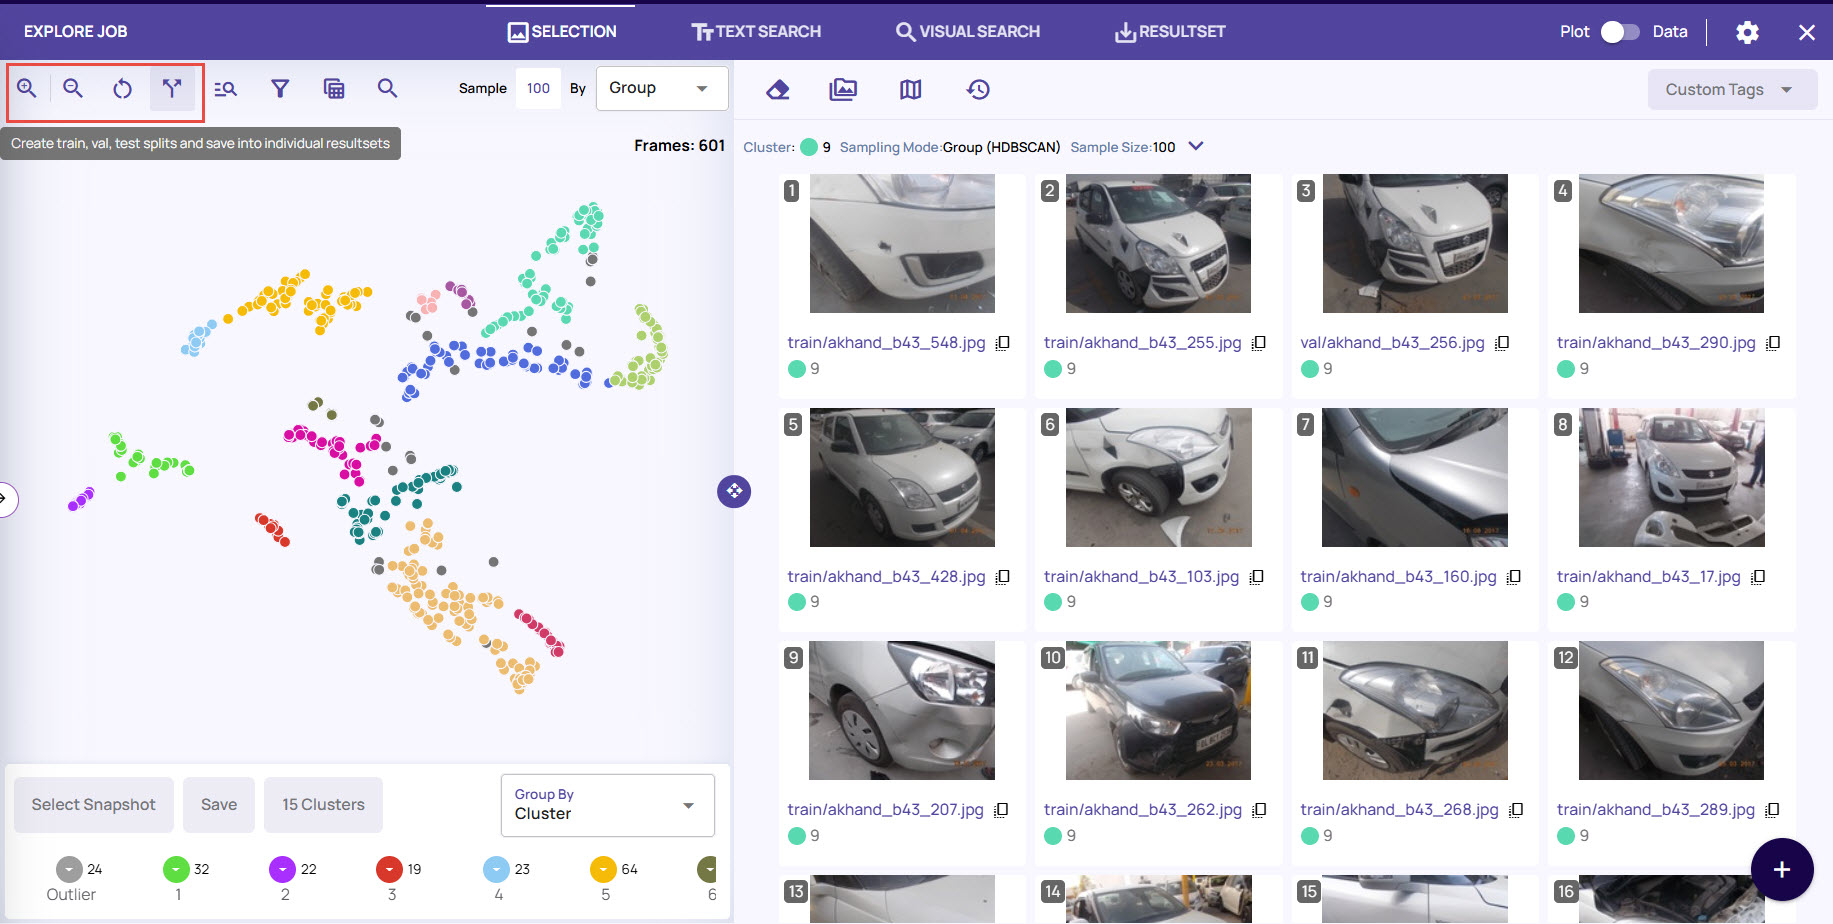
Click the zoom-in and zoom-out icons to zoom in on the data points and select the required data point.
Click the Reset icon to revert the page to the original form by resetting all the settings.
Search
You can search for image frames using the file name.
On the Plot mode, click the search icon at the top
In the File Search screen, enter the file name.
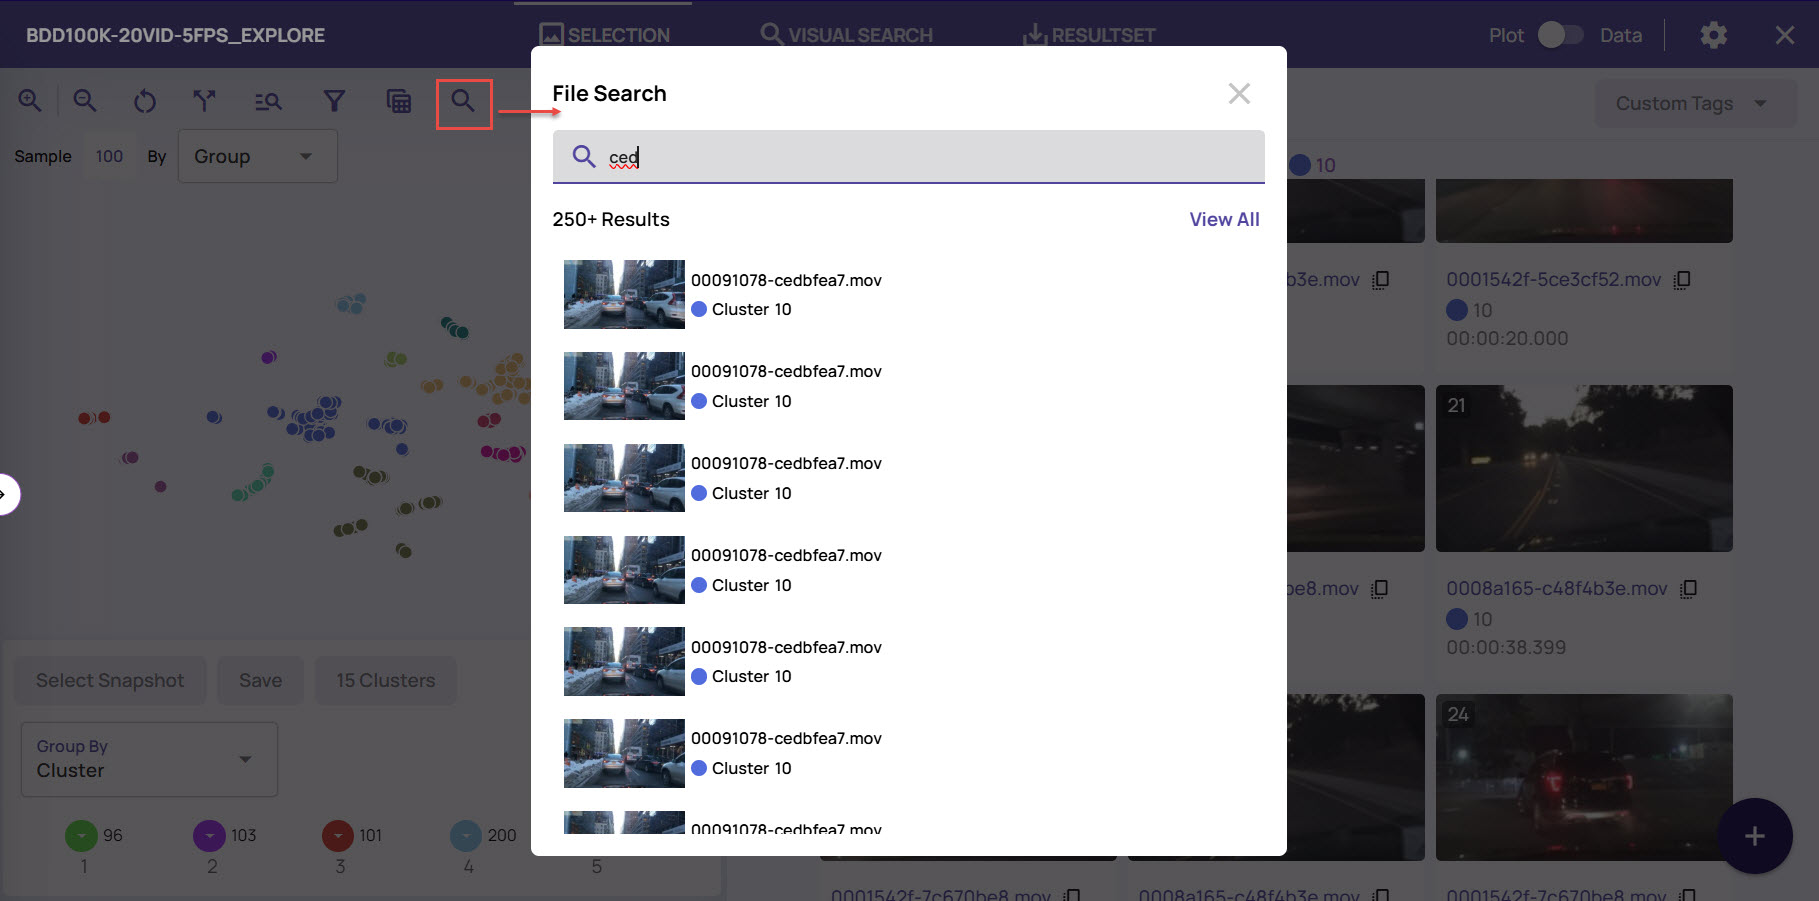
All image frames whose file names match are listed on the File Search screen.
Filters
The 'Filter' button provides the following filtering criteria selection,
Cluster - Choose a subset of clusters to be displayed.
Confidence - Choose only those points with clustering confidence within the selected range.
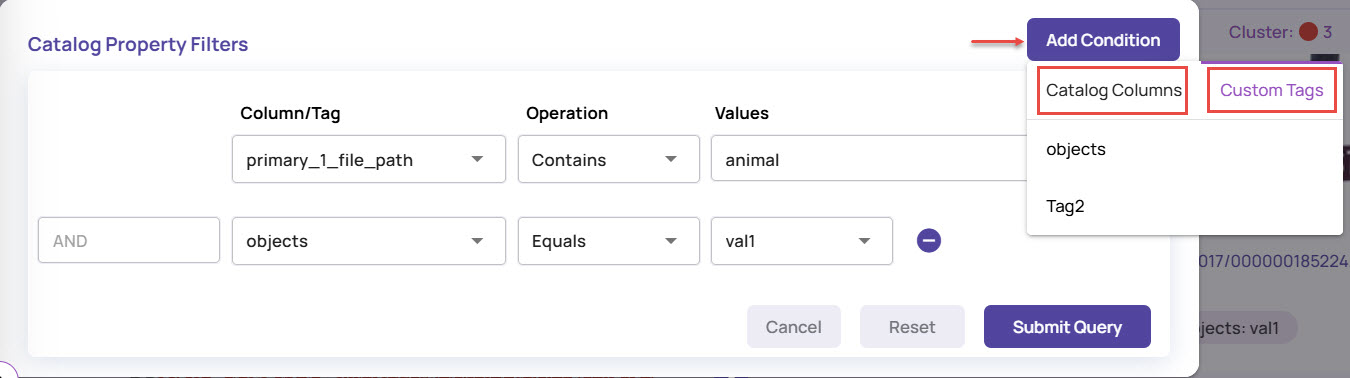
Catalog Property Filters
The Catalog Property Filters option allows you to filter the visualization results based on the selected dataset table columns. If you have set custom tags for the images, you can use these tags to filter images.
Splitting and Merging Clusters
If a cluster contains many points, it may be helpful to split it into sub-clusters for sampling and refinement. The reverse operation of merging a cluster with the rest of the clusters is also supported.
To split the cluster:
Click the Split icon to create Test, Train and Val splits and save them into individual resultsets.
The default split fractions are set to 0.2 for Test, 0.5 for Train, and 0.3 for Val. You can change the fractions, if needed
Click the Submit button and save the resultset.
.jpg)
Adding sampled points to a resultset
A resultset represents a curated set of points. The points can be added to a resultset from the selection panel using the controls highlighted in the picture below.
.png)