Job creation and visualization
- 15 Mar 2023
- 3 Minutes to read
- Print
- DarkLight
- PDF
Job creation and visualization
- Updated on 15 Mar 2023
- 3 Minutes to read
- Print
- DarkLight
- PDF
Article Summary
Share feedback
Thanks for sharing your feedback!
Overview
The below video provides an overview of the steps to create a data visualization job from the catalog page.
Job Creation
Job Creation
Follow the below instructions to create a job,
- Navigate to the catalog as described here.
- Use 'Added Conditions' to filter the entries.
- Click 'Visualize',
- If the default number of frames (500) is set in the query, a confirmation dialogue is presented, as shown below.

- Click on the 'Change' button to update the query with a different limit value for the number of images/frames.
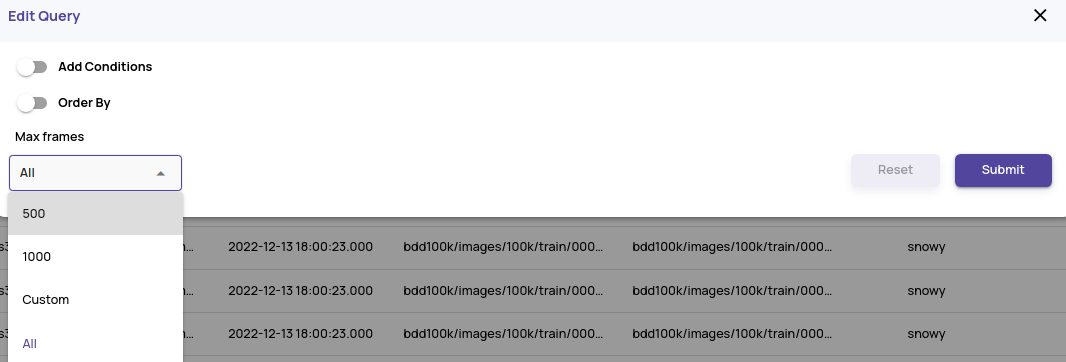
- This will rerun the query. If the query output is fine, click on the 'Visualize' button.
- Select job parameters like name, clusterer, embedder, etc.
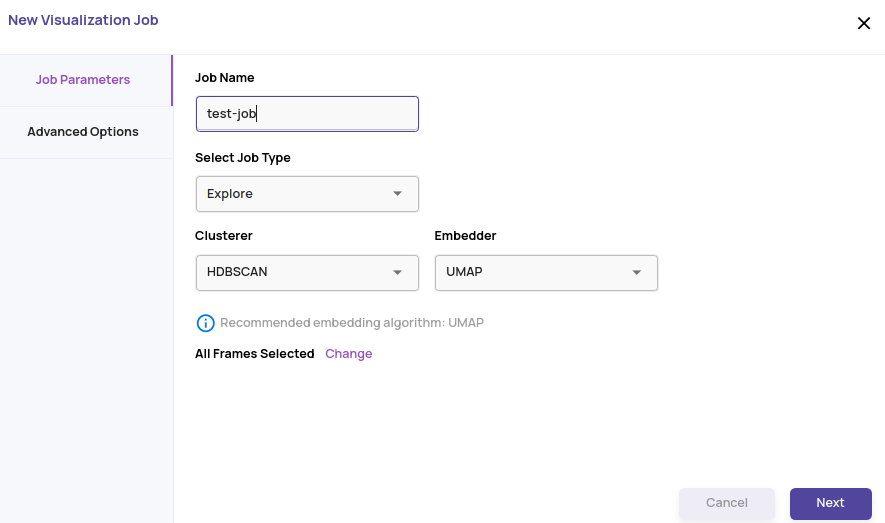
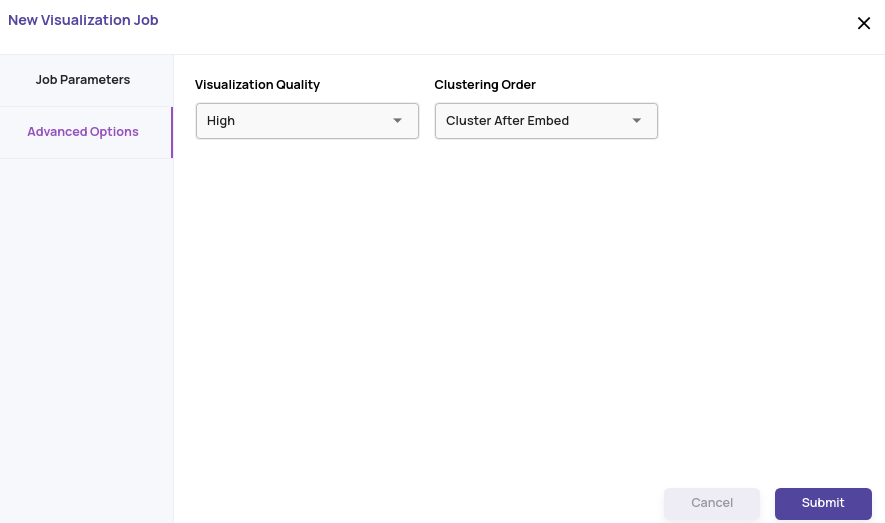
- Click 'Next' and set up the 'Advanced Options'. Leaving these options at default values should suffice for most use cases.
- Click on the 'Submit' button to start processing the job.
- Navigate to 'Jobs' page on the left navigation panel.
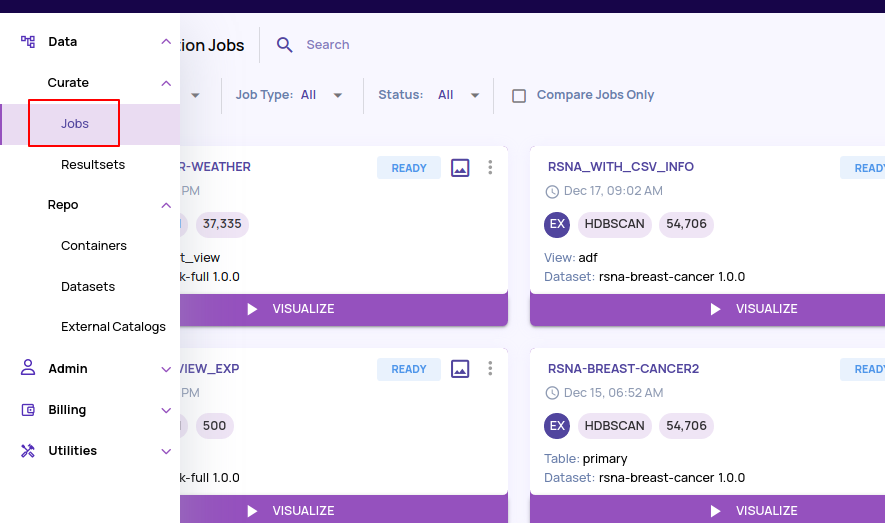
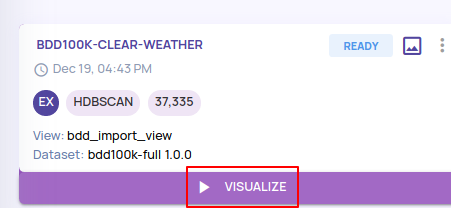
- The job transitions through states like 'CREATED', 'PROCESSING', and finally, when it is ready, the 'VISUALIZE' button appears, as shown below.


Submit option details
Select the following options during the Submit operation:
- Clusterer: The following clustering algorithms are available for selection,
- K-means - In this mode, the user must provide the number of clusters.
- HDBSCAN - This mode clusters the data as per the Hierarchical Density-Based Spatial Clustering of Applications with Noise algorithm. The HDBSCAN generates a cluster of non-spherical nature. The user isn’t required to specify any initial number of clusters to work upon; instead, the appropriate number of clusters is computed implicitly.
- K-segmentation - The k-Segmentation method creates data segments by considering the time dimension and the feature data. This provides insights into how data pattern transitions on a timeline. The K-Segmentation method is most suitable for video data.
- Embedder: The following embedding algorithms are available for selection,
- UMAP
- Principal Component Analysis (PCA)
- Locally linear embedding (LLE)
The Data Explorer automatically provides a recommended embedding algorithm based on the selected clustering algorithm. You can override the recommended algorithm.
- Advanced Options:
- Clustering before embedding - The default choice is to cluster after embedding the features into 2D space. This provides a good visual separation of clusters and allows easy navigation on the UI. The default can be overridden, which may give the better assignment of objects to clusters due to additional features being used at the expense of clean visual separation on the UI.
- Visualization quality - The Visualization quality is tunable and provides a trade-off between visualization speed and quality. The better the visualization quality selected, the slower the visualization speed.
Visualization overview

On clicking the 'Visualize' button, the above page is shown. The display elements and controls on this page are described below:
- Job name: Click on the job name to get more details.
- Operation tabs: The top category of operations are presented as tabs. The following options are available.
- Selection - provides data exploration, sampling, and selection.
- Search - provides similarity search operations
- Resultset - provides storing and retrieval of a curated set of objects that were curated using selection and search tabs.
- Plot view: By default, the objects are colored by the clusters they are assigned to. Each point represents one object (image/video frame), and a quick preview is presented on hover.
- Filters, tunables, catalog filters: These controls allow filtering the contents in the plot view.
- Filters - Filter based on cluster number, partition number, etc.
- Tunables - Sample a fraction of the points based on a choice of sampling modes and a sampling fraction.
- Catalog filters - Apply a filtering condition based on an attribute in the catalog.
- Zoom-in/out controls
- Sampling modes: A click on a point in the plot view populates the right panel with sampled points as thumbnails. The set of sampled points is based on the sampling mode selected. The following sampling modes are available.
- KNN - Nearest neighbor based sampling.
- Group - Sample based on a group selected by the group selector (control number 12). The default group selector is the clusterer.
- Random - Sample a random selection of points. This is useful to quickly preview through a wide set of points in the plot view.
- Manual - The specific clicked point is sampled, and its thumbnail is added to the right panel.
- Thumbnail panel controls: This section has the following controls (left to right)
- The number of samples to be populated in the right panel.
- Clear all points in the right panel.
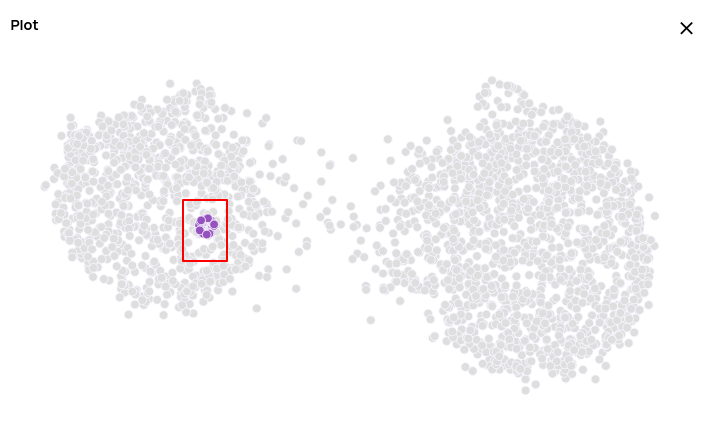
- Highlight the right panel points on the plot view. As seen below, the points corresponding to the thumbnails in the right panel are highlighted.
- Settings: Controls for selecting thumbnail size.
- Per image actions (from left to right):
- Thumbs-up - Express a 'like' on the thumbnail for similarity search.
- Thumbs-down - Express a 'dislike' on the thumbnail for similarity search.
- See full-resolution image.
- Add image to resultset.
- Split resize control: Resize the split between the plot view and thumbnail panel.
- Cluster color legend: Color legend to map point colors to group numbers.
- Group by criteria: The criteria on which colors are assigned to the points. By default, the cluster number is the grouping criteria used.
- Add to resultset: Adding curated/selected objects to the resultset. This button connects data curation (selection and search) with storing this curated list for later retrieval.

Was this article helpful?